Fig. 6.
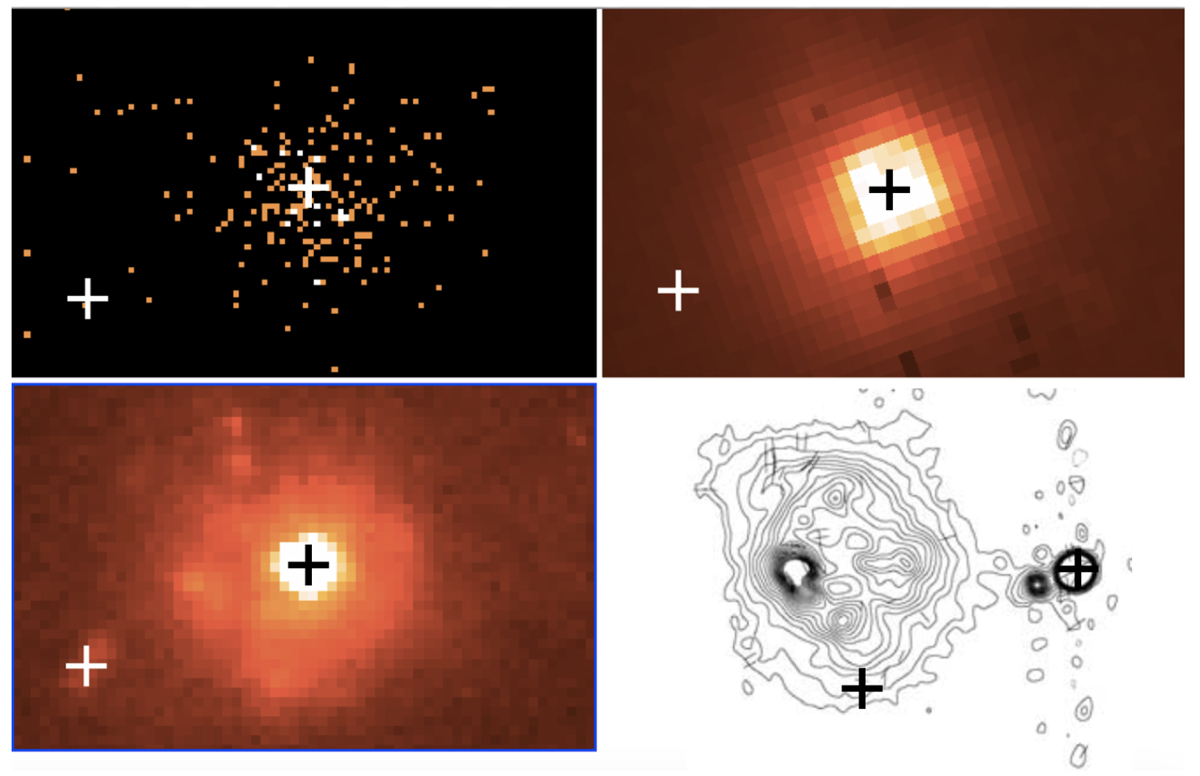
Multiband images of the nuclear regions of 3C 459, Chandra (top left panel), infrared HST (top right panel), optical HST (bottom left panel), and radio from MERLIN 1658 MHz (bottom right panel). The two crosses indicate the location of the emission line peaks. In the Chandra image the pixel size is 0.06″ (below the Chandra native resolution of 0.459″). The Merlin image has the same field of view, but it is shifted by 1″ to the west to show the radio structure best.
Current usage metrics show cumulative count of Article Views (full-text article views including HTML views, PDF and ePub downloads, according to the available data) and Abstracts Views on Vision4Press platform.
Data correspond to usage on the plateform after 2015. The current usage metrics is available 48-96 hours after online publication and is updated daily on week days.
Initial download of the metrics may take a while.