Fig. 3.
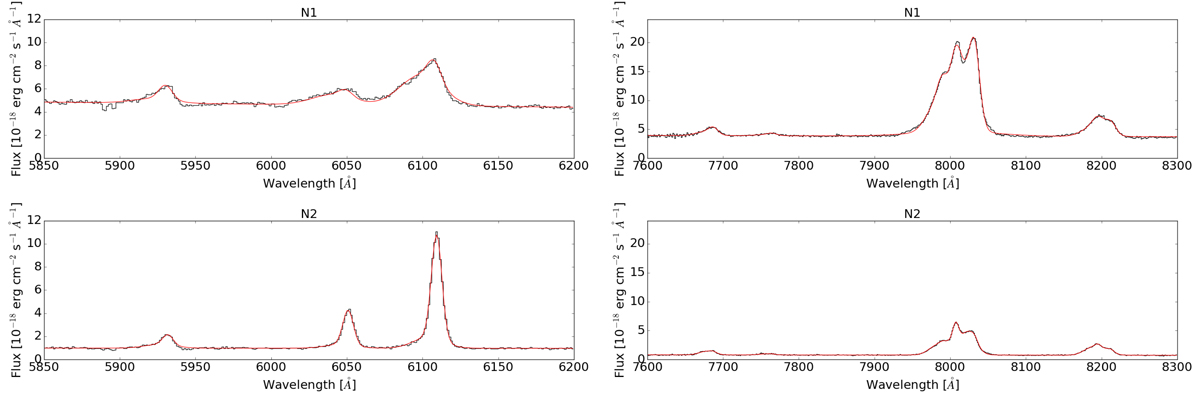
Comparison of the spectra of the two nuclear line knots (top panels: for the nucleus of the radio galaxy, N1, bottom panels: for the putative QSO2, N2) extracted from a squared synthetic aperture of side 0″.6. Wavelengths are shown in observed frame. In the spectra are visible the Hβ and [O III] doublet on the left and [O I] , the [N II] +Hα complex, and the [S II] doublet on the right.
Current usage metrics show cumulative count of Article Views (full-text article views including HTML views, PDF and ePub downloads, according to the available data) and Abstracts Views on Vision4Press platform.
Data correspond to usage on the plateform after 2015. The current usage metrics is available 48-96 hours after online publication and is updated daily on week days.
Initial download of the metrics may take a while.