Fig. 1.
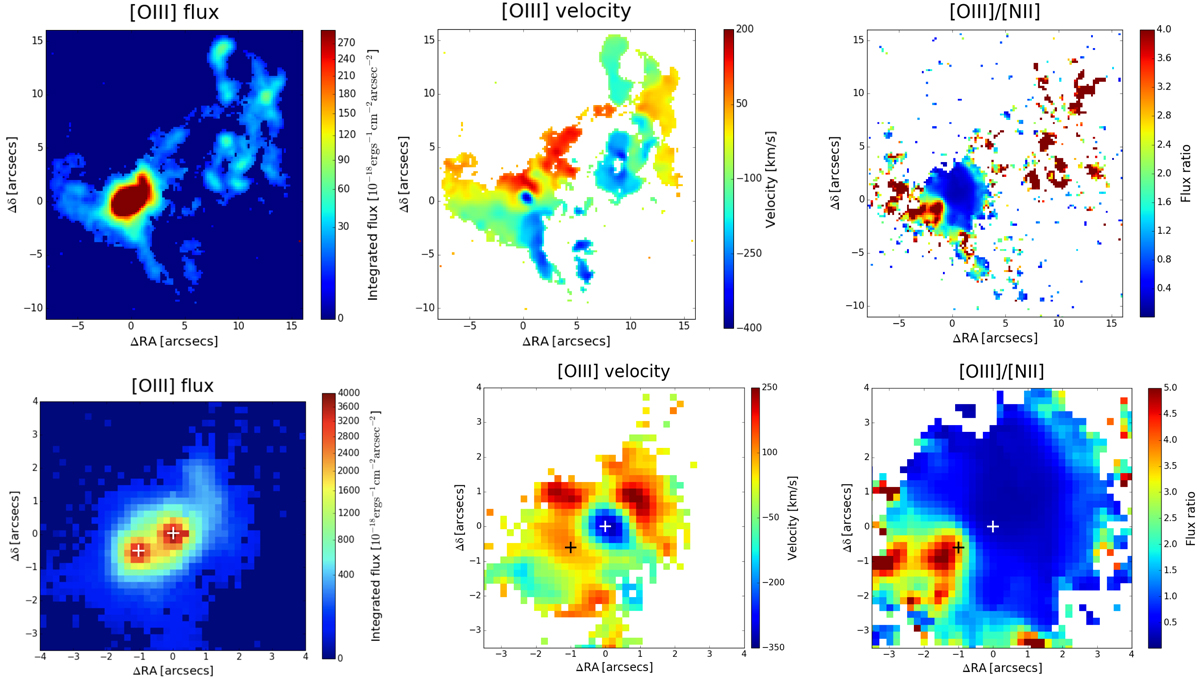
Left panels: [O III] images smoothed with a Gaussian kernel of 0.5″ covering the whole extent of the ionized gas nebula, 120 × 110 kpc, (top panel) and (bottom panel) zooming onto the central 33 × 33 kpc. Center panels: velocity field derived from the same line. Right panels: gas ionization map obtained from the ratio of the [O III] and [N II] lines. The plus symbols indicate the location of N1 and N2.
Current usage metrics show cumulative count of Article Views (full-text article views including HTML views, PDF and ePub downloads, according to the available data) and Abstracts Views on Vision4Press platform.
Data correspond to usage on the plateform after 2015. The current usage metrics is available 48-96 hours after online publication and is updated daily on week days.
Initial download of the metrics may take a while.