Fig. 6.
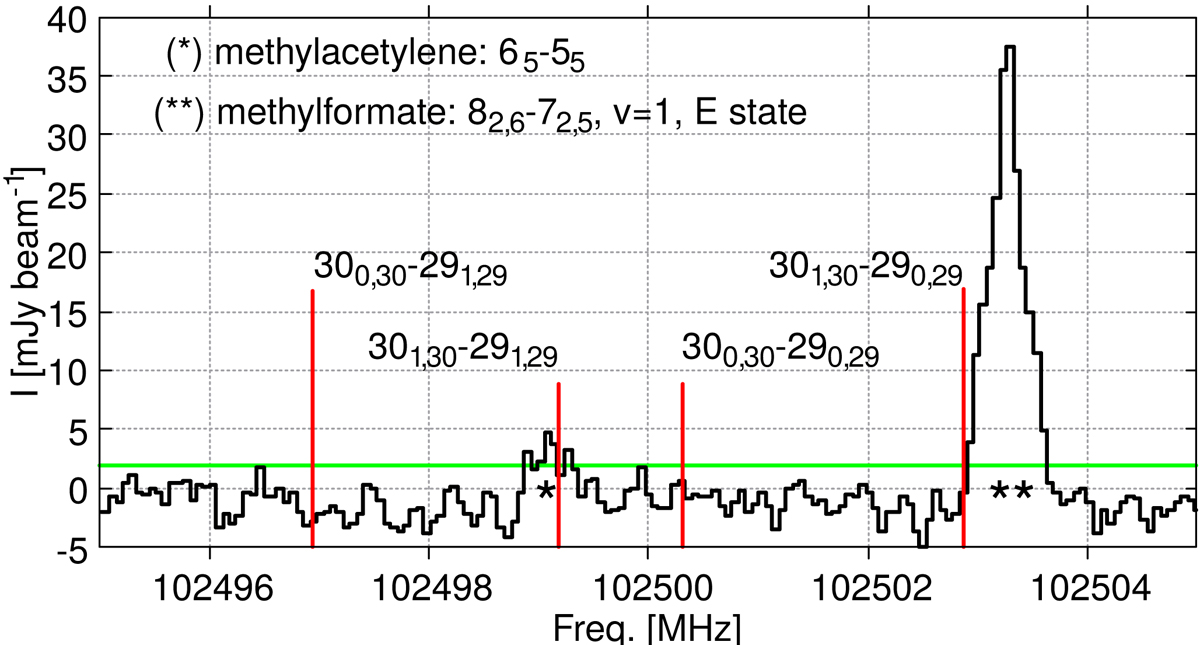
Spectrum in the central beam toward the continuum peaks of IRAS 16293-2422 B. Predicted 30 x, 30 − 29 x, 29 transition lines of aG′Ag-12BD are overplotted as red sticks. The X-axis represents the frequencies in the rest frame of the system (i.e., corrected for the system V LSR of 2.7 km s−1; Jørgensen et al. 2011). The green line is an indication of the rms level (1.89 mJy beam−1) represented by a spectrum extracted from an off source position.
Current usage metrics show cumulative count of Article Views (full-text article views including HTML views, PDF and ePub downloads, according to the available data) and Abstracts Views on Vision4Press platform.
Data correspond to usage on the plateform after 2015. The current usage metrics is available 48-96 hours after online publication and is updated daily on week days.
Initial download of the metrics may take a while.