Fig. C.1.
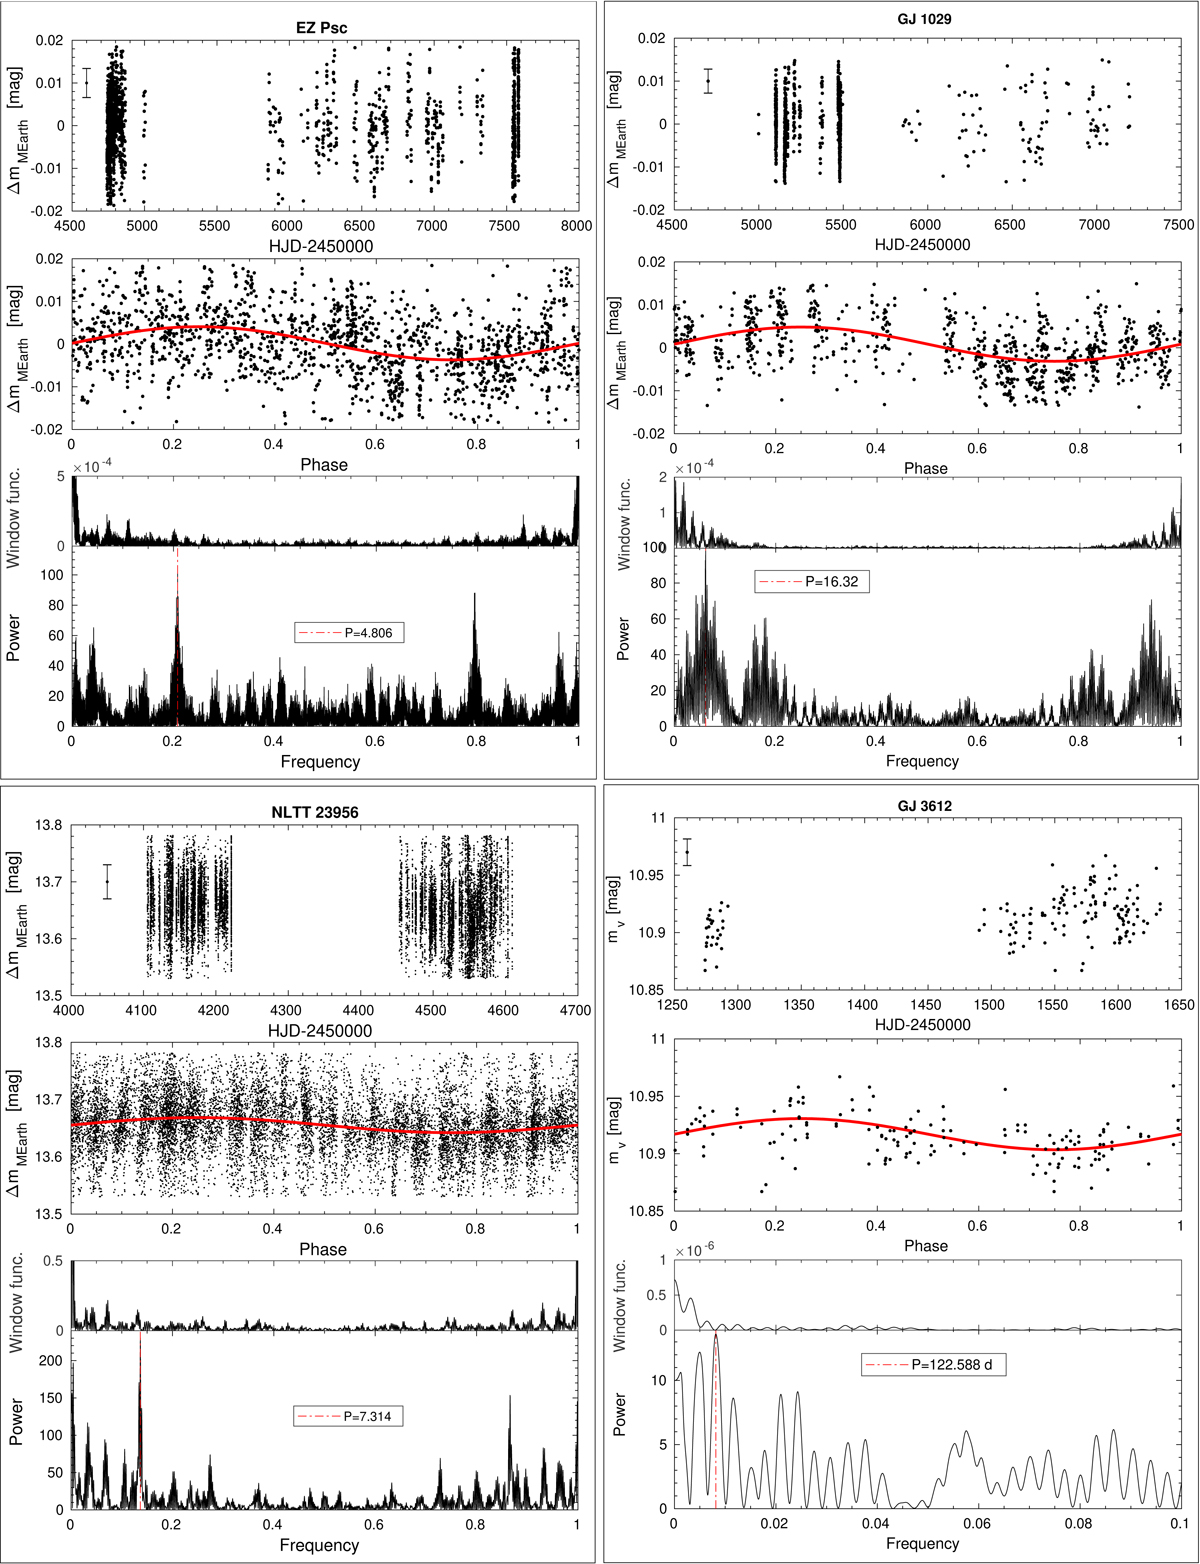
Photometry data and analysis for the stellar systems analysed in this work. Each panel corresponds to a binary system as labelled. For each system, top panel: light curve as a function of time and mean value of the uncertainty of the observations. Middle panel: light curve phase to the photometric period found and the best sinusoidal fit. Bottom panel: periodogram and window function of the data and the best period found (red dot-dashed line).
Current usage metrics show cumulative count of Article Views (full-text article views including HTML views, PDF and ePub downloads, according to the available data) and Abstracts Views on Vision4Press platform.
Data correspond to usage on the plateform after 2015. The current usage metrics is available 48-96 hours after online publication and is updated daily on week days.
Initial download of the metrics may take a while.