Fig. B.1.
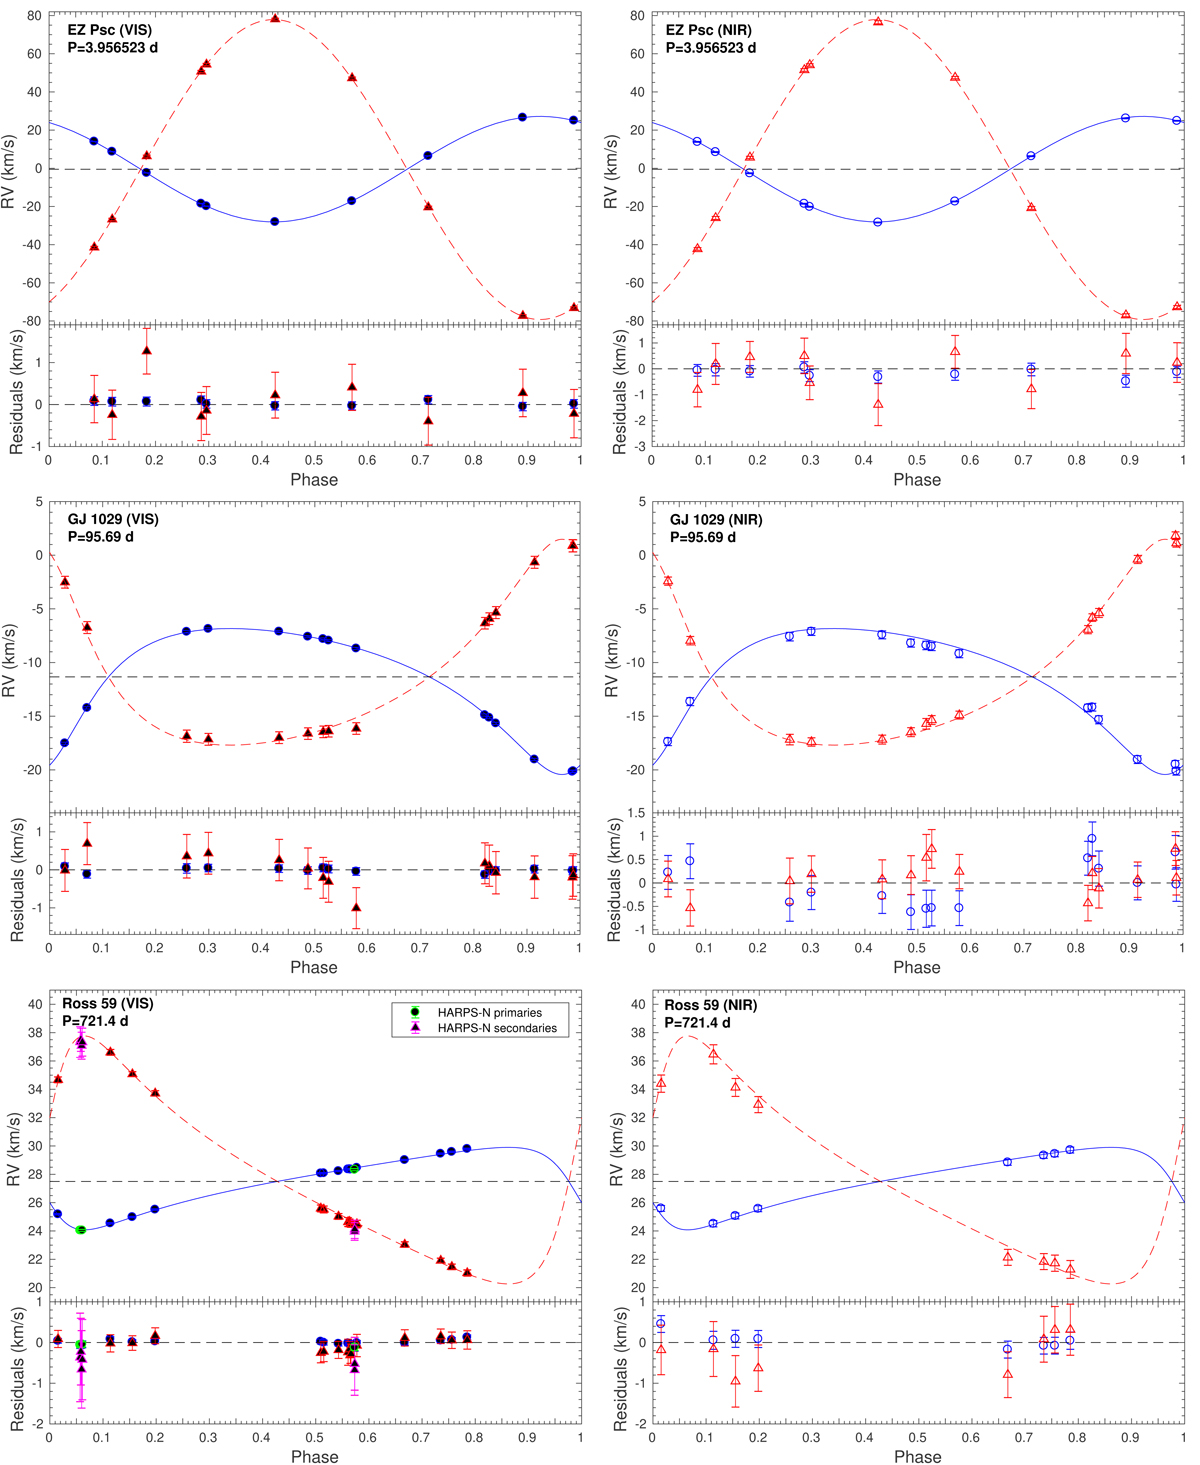
Radial velocity curves of our targets as a function of the orbital phase. VIS and NIR CARMENES data are shown in the left and right panels, respectively, for each target as labelled. The top plot in each panel displays the radial velocity data of the primary (blue circle) and secondary (red triangle) components, along with their best-fitting models (blue solid and red dashed lines, respectively). The bottom plot on each panel shows the residuals of the best fit. For Ross 59, HARPS data for the primary (green circles) and secondary (violet triangles) are also shown.
Current usage metrics show cumulative count of Article Views (full-text article views including HTML views, PDF and ePub downloads, according to the available data) and Abstracts Views on Vision4Press platform.
Data correspond to usage on the plateform after 2015. The current usage metrics is available 48-96 hours after online publication and is updated daily on week days.
Initial download of the metrics may take a while.