Fig. 13
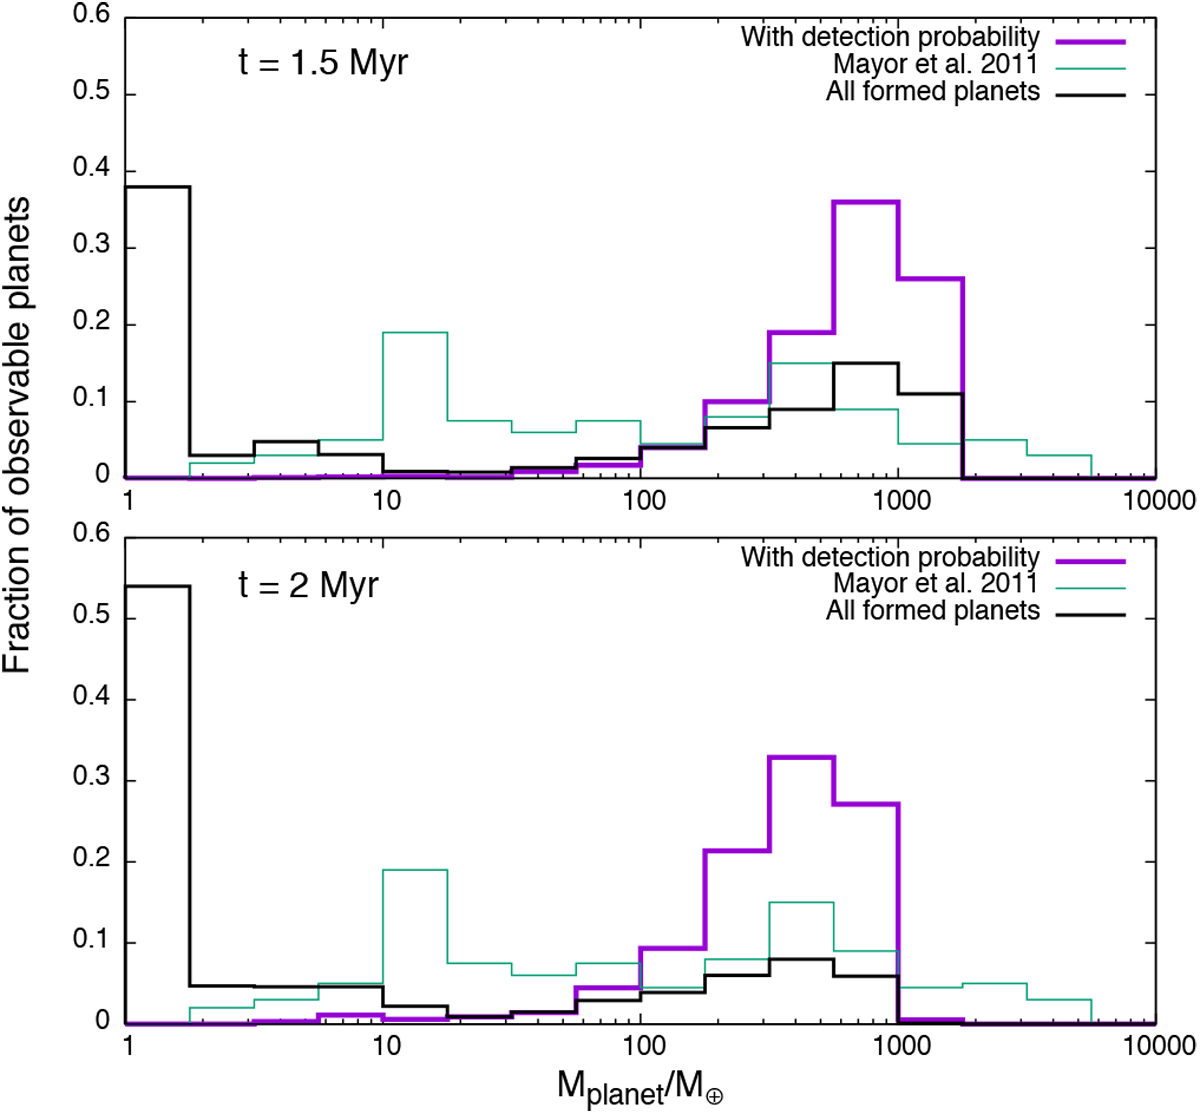
Mass function of our simulations using the B15b approach compared with the results presented in Mayor et al. (2011), for planets with afinal > 0.1 AU. The upper graph represents the simulations with embryos starting at t = 1.5 Myr of the evolution of the disc and the lower one the embryos starting after t = 2 Myr. The green line represents the results presented in Mayor et al. (2011), the black line shows all the planets we form beyond 0.1 AU, and the purple one indicates the planets considered as observed once the detection probability is applied.
Current usage metrics show cumulative count of Article Views (full-text article views including HTML views, PDF and ePub downloads, according to the available data) and Abstracts Views on Vision4Press platform.
Data correspond to usage on the plateform after 2015. The current usage metrics is available 48-96 hours after online publication and is updated daily on week days.
Initial download of the metrics may take a while.