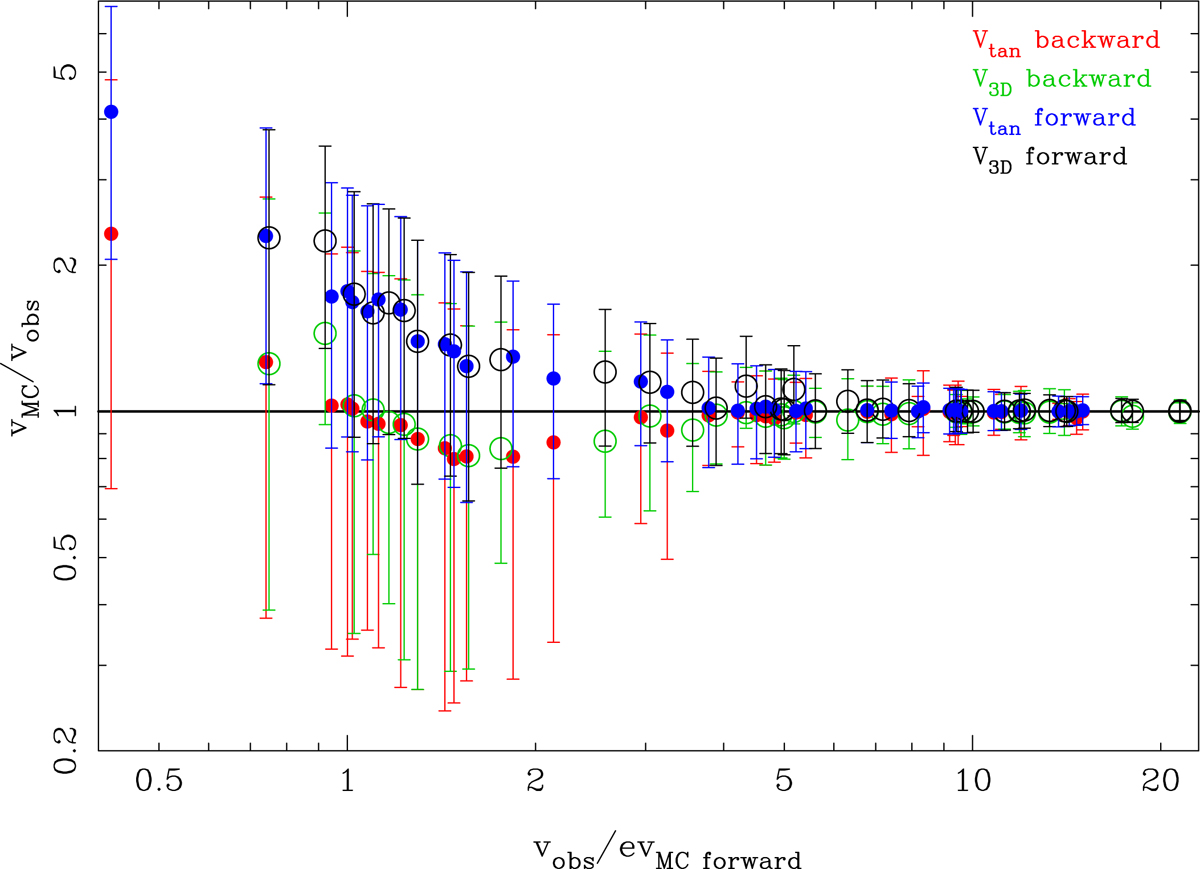
Fig. B.1.

Comparison of errors and values for positive-defined quantities such as ν3D and νvtan, using forward and backward Monte Carlo simulations. The x-axis gives the ratio of observed velocity to the error given by the forward MC simulations, while the y-axis shows the ratio of the median velocity obtained from the MC simulations (forward or backward, see legend) to the observed value.
Current usage metrics show cumulative count of Article Views (full-text article views including HTML views, PDF and ePub downloads, according to the available data) and Abstracts Views on Vision4Press platform.
Data correspond to usage on the plateform after 2015. The current usage metrics is available 48-96 hours after online publication and is updated daily on week days.
Initial download of the metrics may take a while.


