Fig. 2.
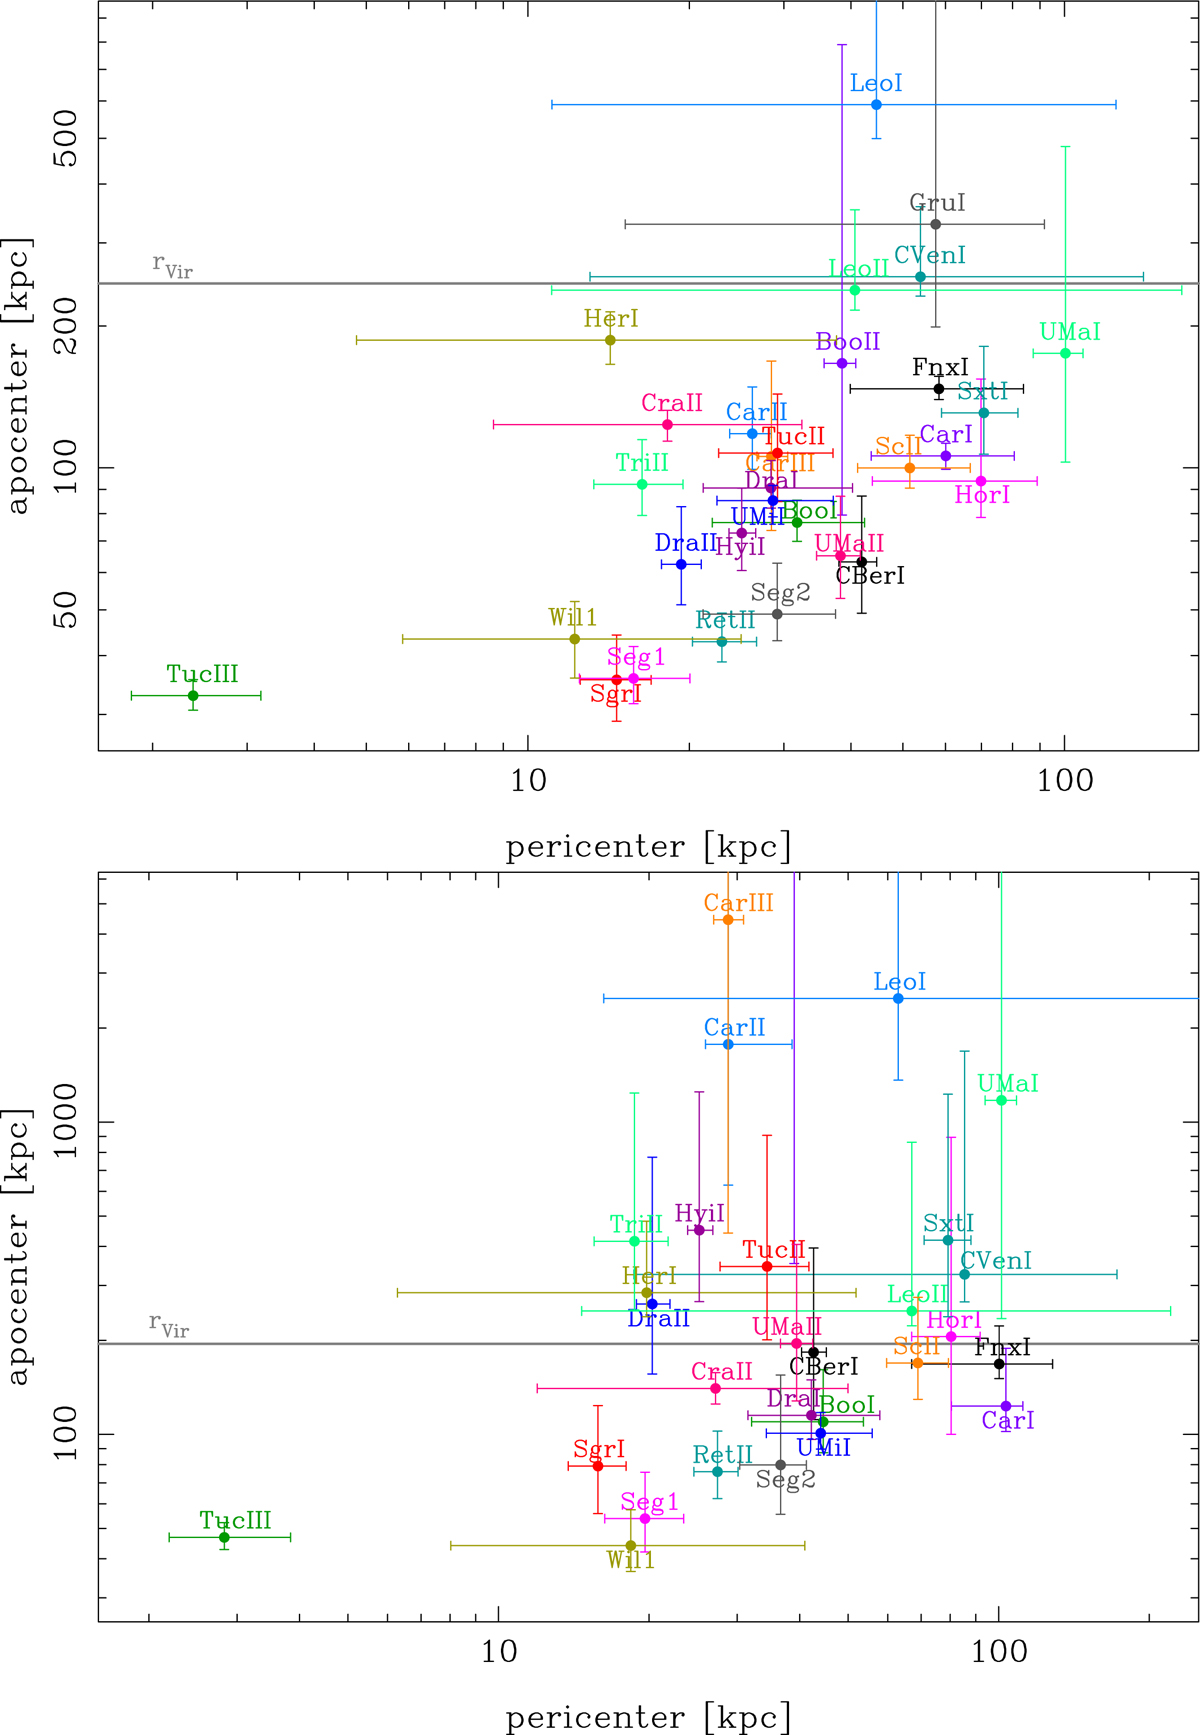
Pericenter vs. apocenter properties of the galaxies in the sample with 3D velocity errors < 100 km s−1, as indicated by the labels. The top panel plot shows the results for a MW DM halo of virial mass equal to 1.6 × 10¹² M⊙, and the lower panel for 0.8 × 10¹² M⊙. We also show typical virial radii in both plots. Gru I is omitted in the lower plot because of the very large apocenter.
Current usage metrics show cumulative count of Article Views (full-text article views including HTML views, PDF and ePub downloads, according to the available data) and Abstracts Views on Vision4Press platform.
Data correspond to usage on the plateform after 2015. The current usage metrics is available 48-96 hours after online publication and is updated daily on week days.
Initial download of the metrics may take a while.