Free Access
Fig. 4.
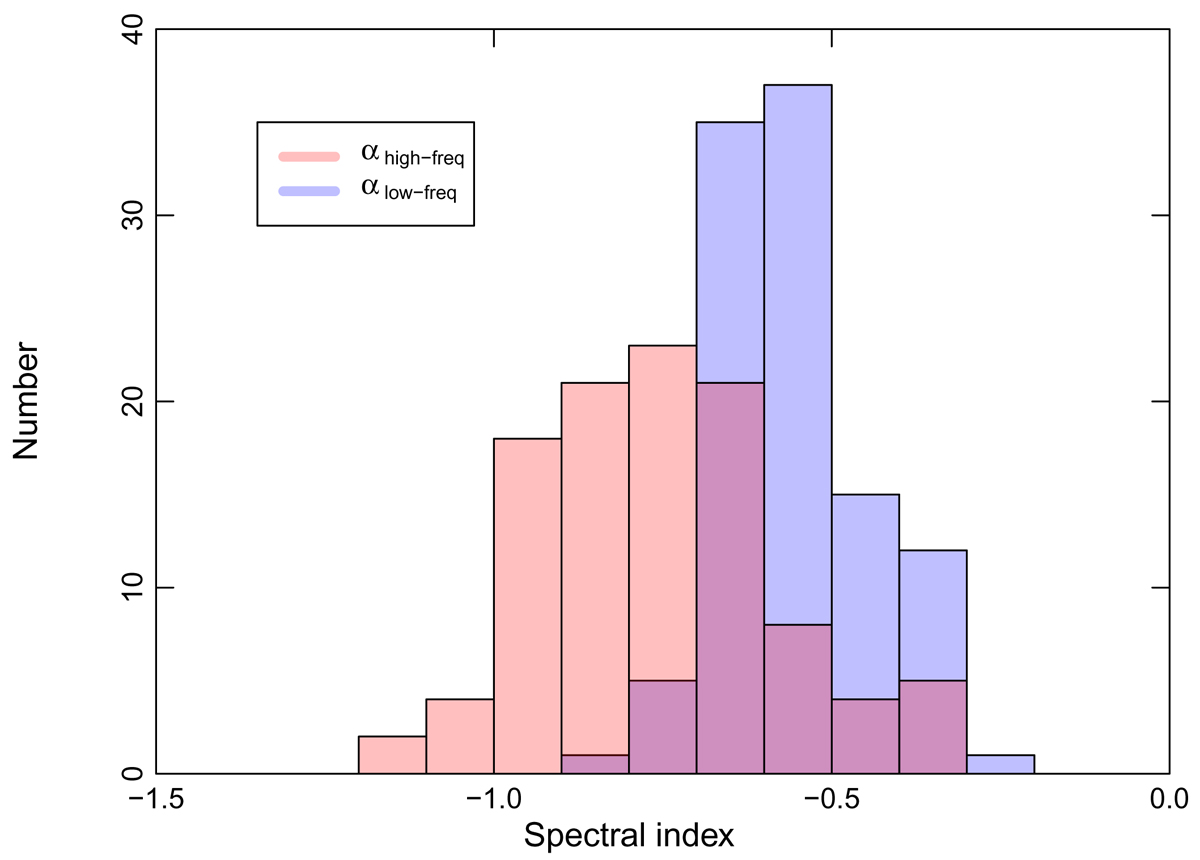
Distributions of the radio low-frequency αlow and high-frequency αhigh spectral indices for the MSSS galaxies (in blue and pink respectively). Overlapping parts of the histograms are in violet.
Current usage metrics show cumulative count of Article Views (full-text article views including HTML views, PDF and ePub downloads, according to the available data) and Abstracts Views on Vision4Press platform.
Data correspond to usage on the plateform after 2015. The current usage metrics is available 48-96 hours after online publication and is updated daily on week days.
Initial download of the metrics may take a while.