Fig. 2.
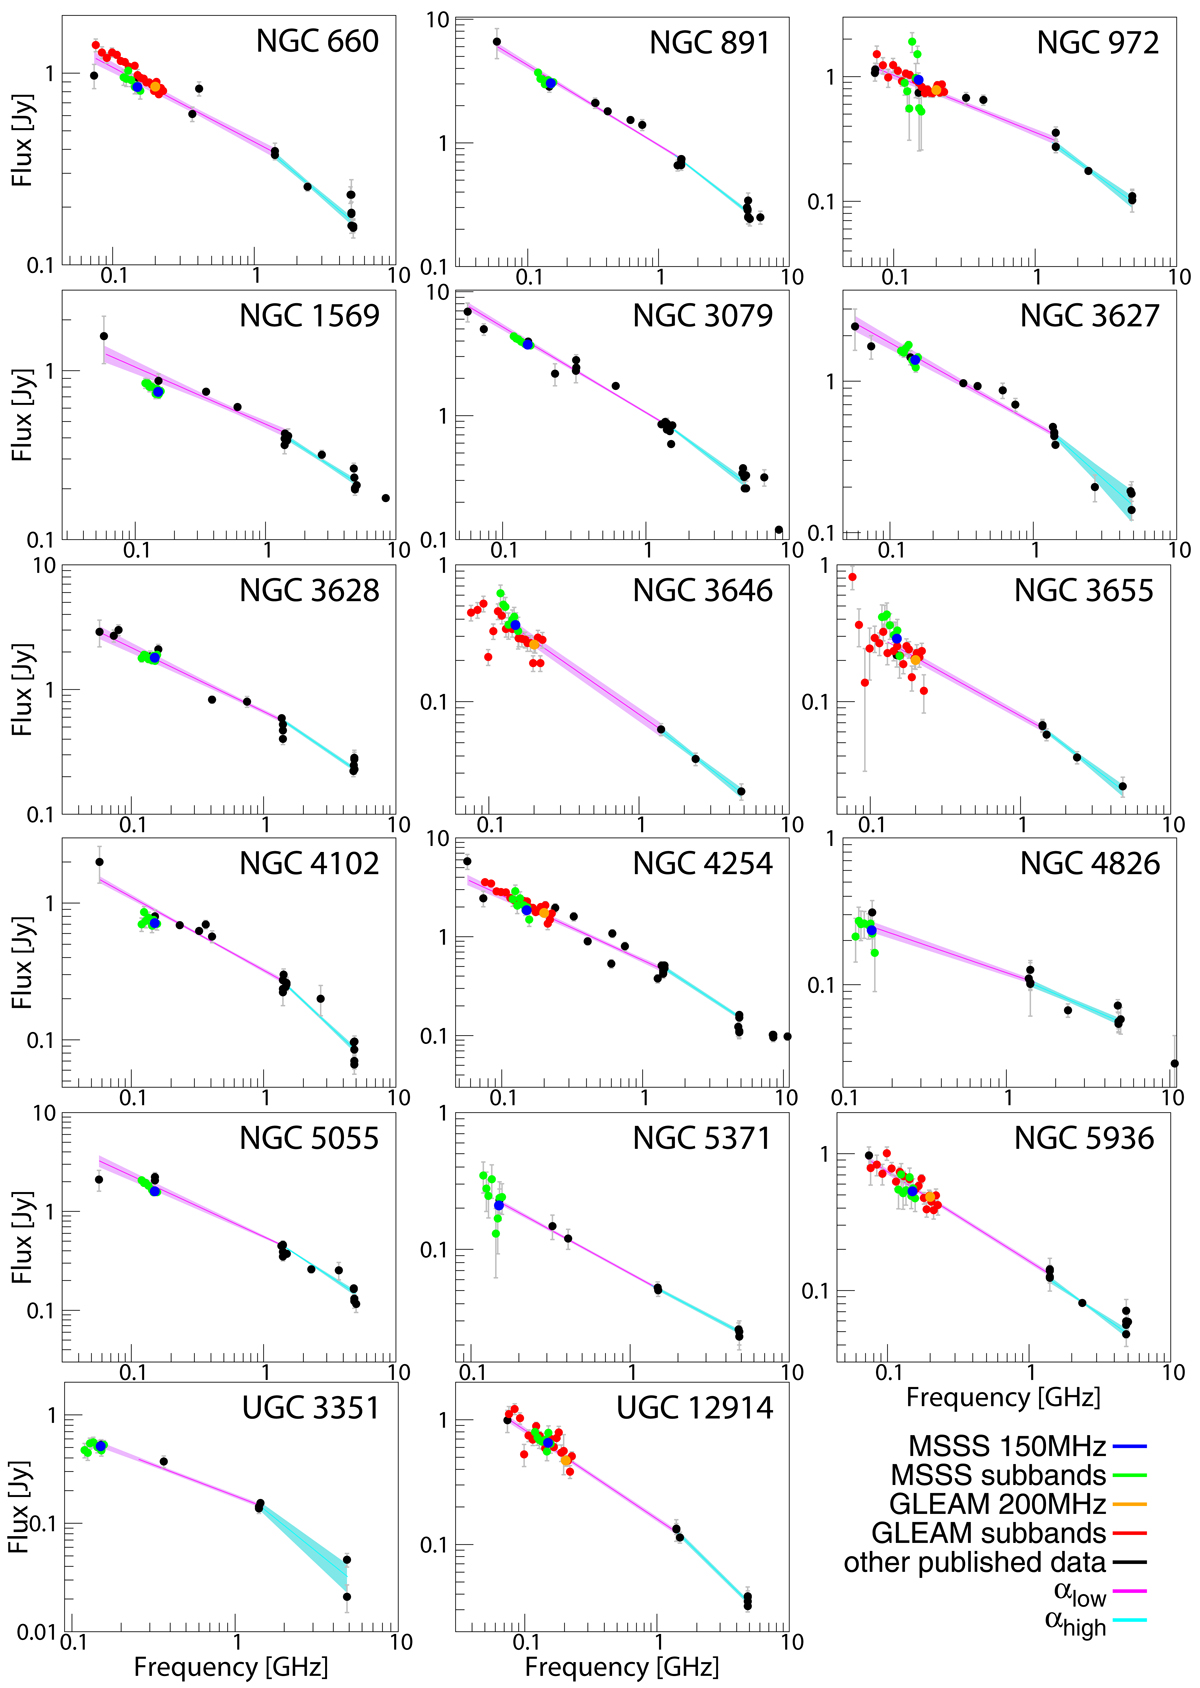
Examples of radio spectra for a subset of MSSS galaxies. The flux densities from eight individual MSSS spectral bands are in green, the interpolated MSSS flux densities at 150 MHz are in blue, the GLEAM flux densities from 20 individual spectral bands (if available) are in red, the GLEAM catalogue fitted flux densities at 200 MHz are in orange, and other published measurements are in black. The pink and black lines represent the low- and high-frequency power-law fits, respectively. Highlighted regions show the 68% confidence bands of the fits.
Current usage metrics show cumulative count of Article Views (full-text article views including HTML views, PDF and ePub downloads, according to the available data) and Abstracts Views on Vision4Press platform.
Data correspond to usage on the plateform after 2015. The current usage metrics is available 48-96 hours after online publication and is updated daily on week days.
Initial download of the metrics may take a while.