Fig. 16.
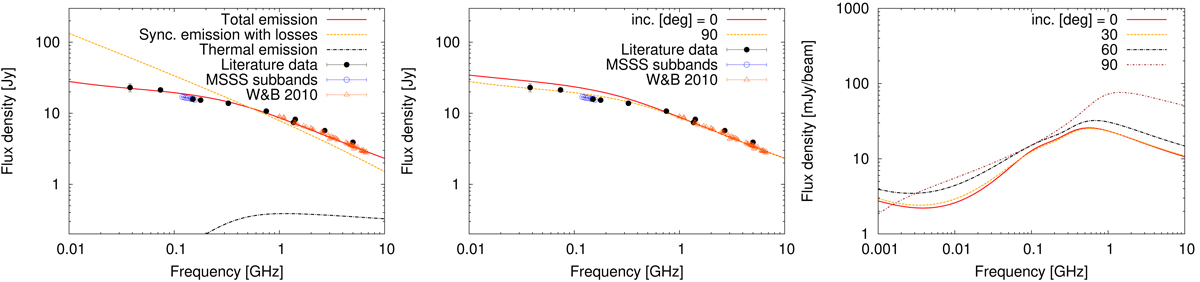
Global spectra from our 3D model of an M 82-like galaxy. Left: global spectrum of a highly inclined galaxy (red solid line) with the synchrotron component without absorption (orange dotted line) and thermal free-free emission with absorption (black dashed line). Black solid circles denote literature data used during modelling, including the interpolated flux density at 150 MHz from the MSSS survey. For the sake of completeness, data from individual MSSS sub-bands (blue circles) and flux densities determined during the commissioning phase of the 42-element Allen Telescope Array (Williams & Bower 2010) (orange triangles) are also shown. Middle: comparison of global spectra for edge-on (orange dotted line) and face-on galaxies (red solid line). Right: local spectra from the galaxy centre for different inclination angles.
Current usage metrics show cumulative count of Article Views (full-text article views including HTML views, PDF and ePub downloads, according to the available data) and Abstracts Views on Vision4Press platform.
Data correspond to usage on the plateform after 2015. The current usage metrics is available 48-96 hours after online publication and is updated daily on week days.
Initial download of the metrics may take a while.