Fig. 14.
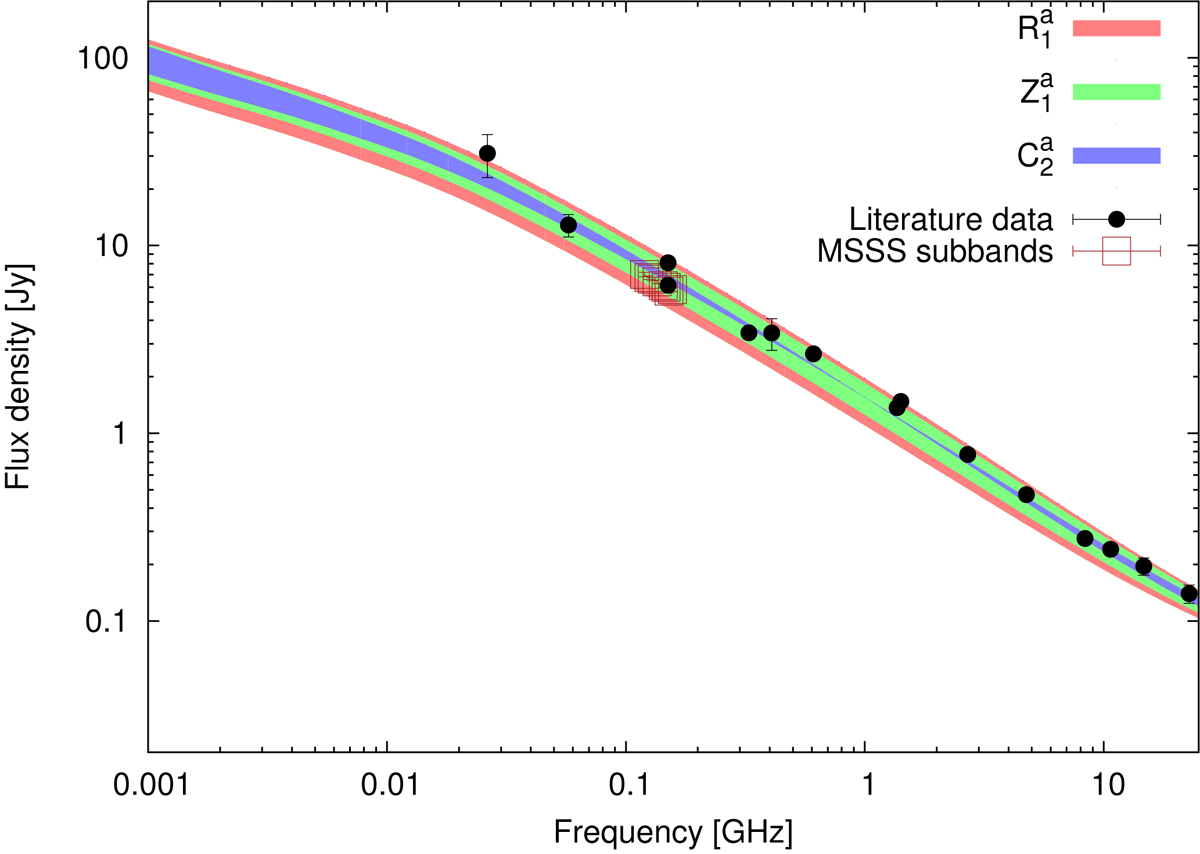
Ranges of the modelled global spectrum of M 51-like galaxy as affected by increasing and decreasing best-fit model parameters ![]() ,
, ![]() , and
, and ![]() by ±20%. Black solid circles denote literature data used during the modelling and the interpolated flux density at 150 MHz from the MSSS survey. For the sake of completeness, the data from individual MSSS sub-bands are also shown (brown rectangles).
by ±20%. Black solid circles denote literature data used during the modelling and the interpolated flux density at 150 MHz from the MSSS survey. For the sake of completeness, the data from individual MSSS sub-bands are also shown (brown rectangles).
Current usage metrics show cumulative count of Article Views (full-text article views including HTML views, PDF and ePub downloads, according to the available data) and Abstracts Views on Vision4Press platform.
Data correspond to usage on the plateform after 2015. The current usage metrics is available 48-96 hours after online publication and is updated daily on week days.
Initial download of the metrics may take a while.