Fig. 1.
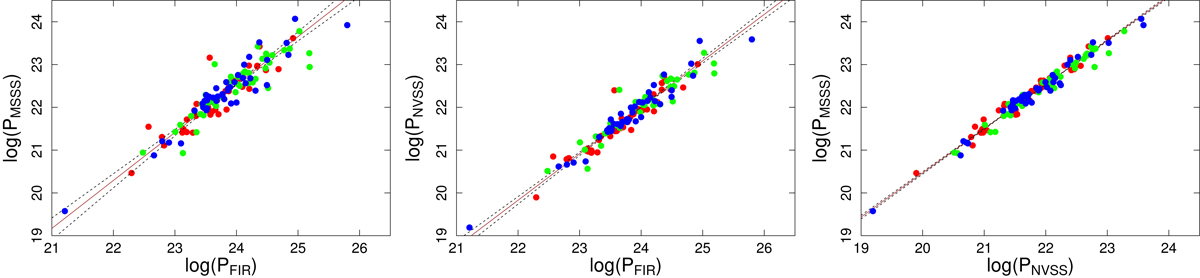
Radio-FIR relation for the low-frequency MSSS (left) and high-frequency NVSS data (middle). The red, blue and green symbols represent faint, medium bright, and bright NVSS galaxies, respectively. The MSSS–NVSS luminosity diagram is shown on the right. The solid line is a bisector fit, while the dashed lines represent simple X vs. Y and Y vs. X linear regressions in the logarithmic space of the parameters.
Current usage metrics show cumulative count of Article Views (full-text article views including HTML views, PDF and ePub downloads, according to the available data) and Abstracts Views on Vision4Press platform.
Data correspond to usage on the plateform after 2015. The current usage metrics is available 48-96 hours after online publication and is updated daily on week days.
Initial download of the metrics may take a while.