Fig. 5
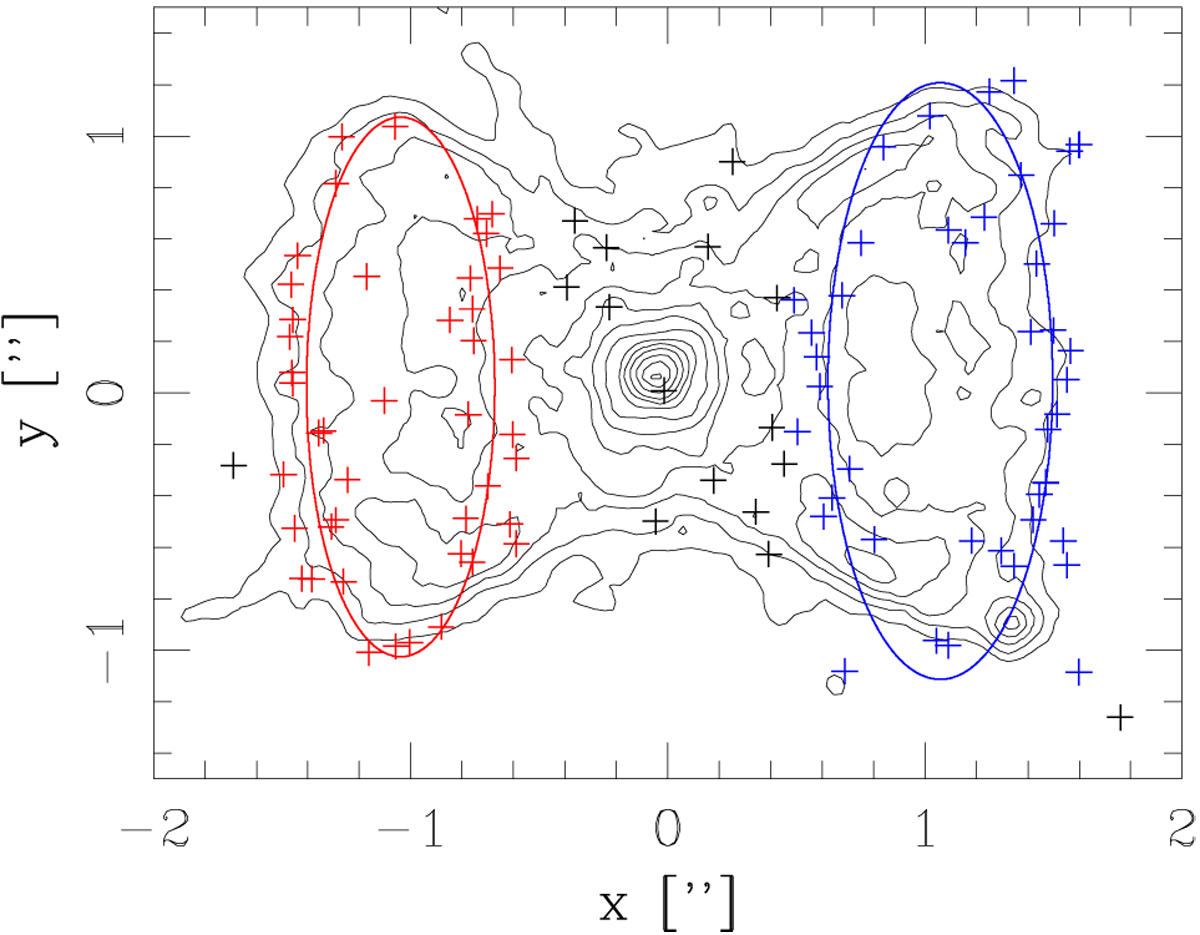
Contour plot of the [N II] emisison of the region around Sanduleak’s star (shown with logarithmic, factor of 2 contours). The crosses indicate the local maxima found in the image, and the red and blue crosses are the values chosen for the elliptical fits (see the text). The resulting ellipses are shown by the red and blue curves (corresponding to the red and blue outflow lobes). The axes are labeled with offsets (in arcsec) from Sanduleak’s star, along and across the outflow axis.
Current usage metrics show cumulative count of Article Views (full-text article views including HTML views, PDF and ePub downloads, according to the available data) and Abstracts Views on Vision4Press platform.
Data correspond to usage on the plateform after 2015. The current usage metrics is available 48-96 hours after online publication and is updated daily on week days.
Initial download of the metrics may take a while.