Fig. 4
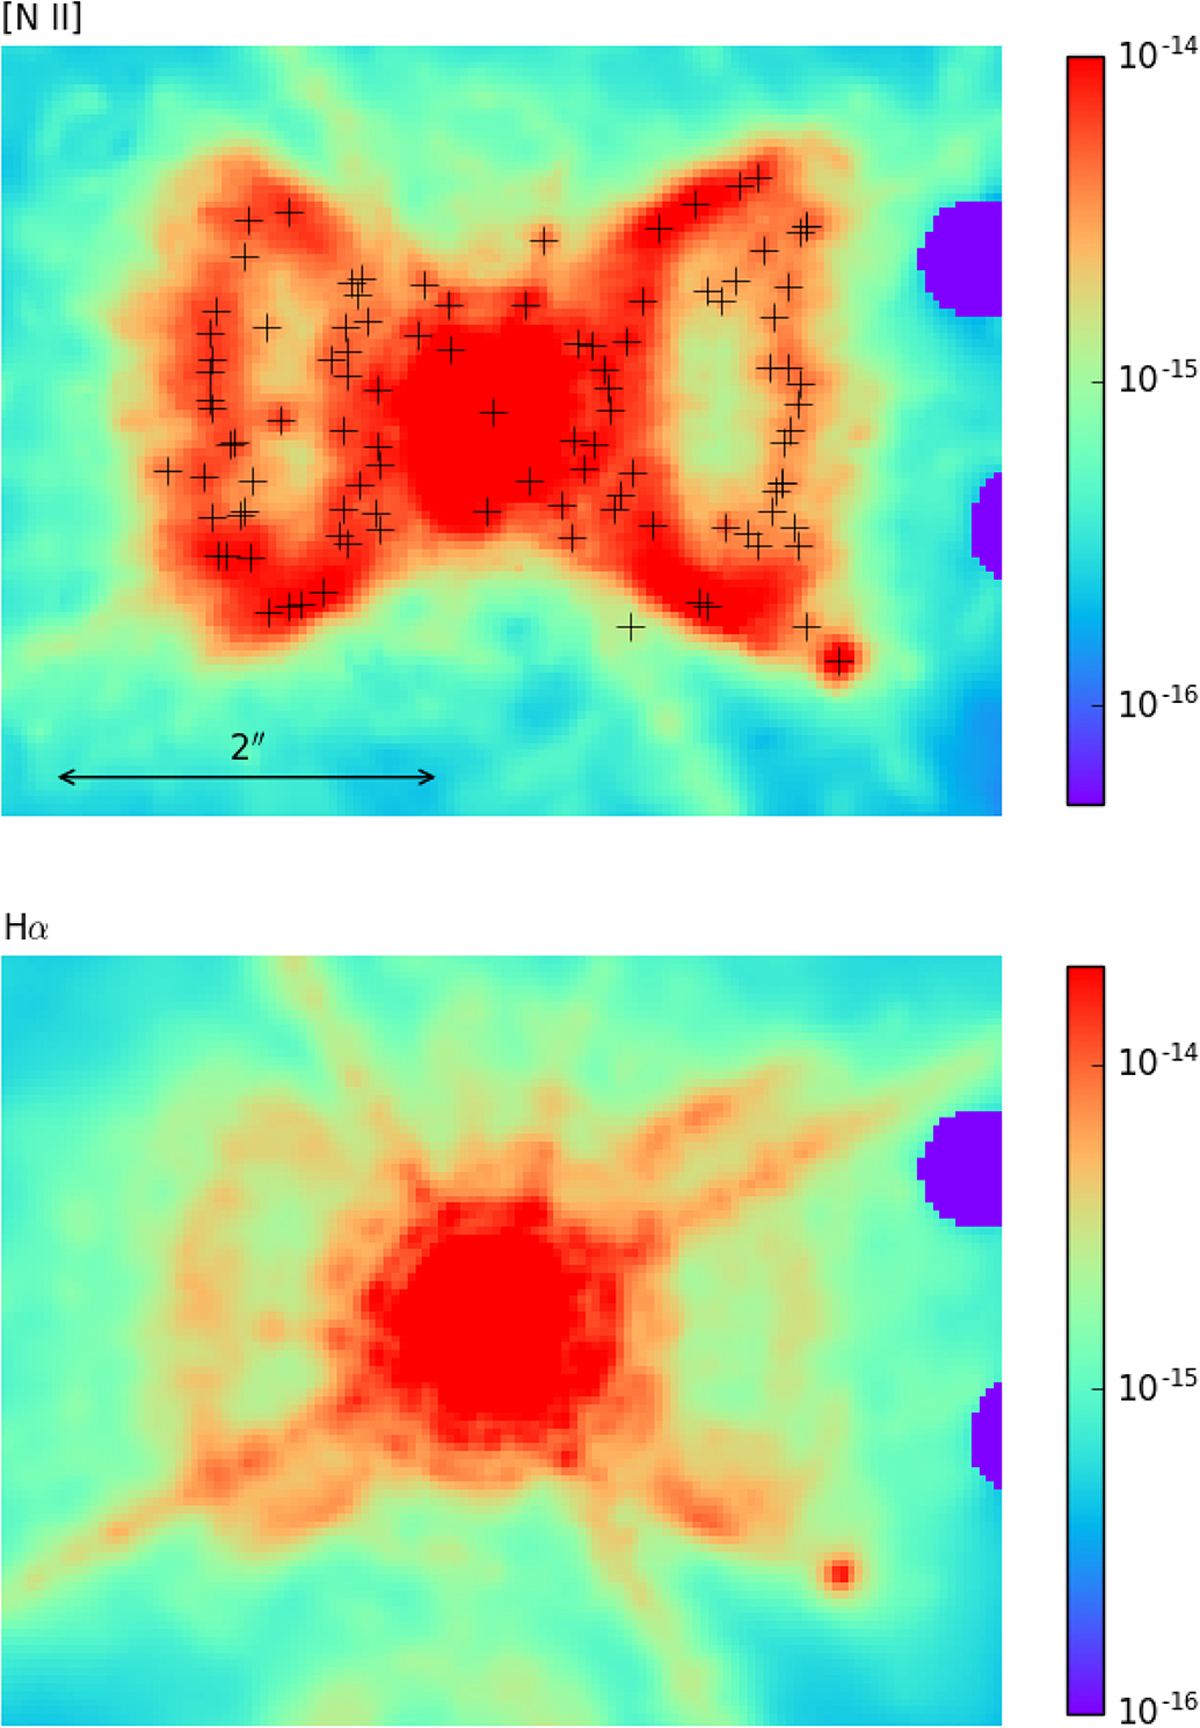
[N II] (top panel) and Hα (bottom panel) maps of the region around Sanduleak’s star (this is the region shown by the central, white box in Fig. 3). The images are shown with the logarithmic colour scales given (in erg s−1 cm−2 arcsec−2) by bars on the right. Diffraction spikes are visible around Sanduleak’s star in the two images.
Current usage metrics show cumulative count of Article Views (full-text article views including HTML views, PDF and ePub downloads, according to the available data) and Abstracts Views on Vision4Press platform.
Data correspond to usage on the plateform after 2015. The current usage metrics is available 48-96 hours after online publication and is updated daily on week days.
Initial download of the metrics may take a while.