Fig. 9
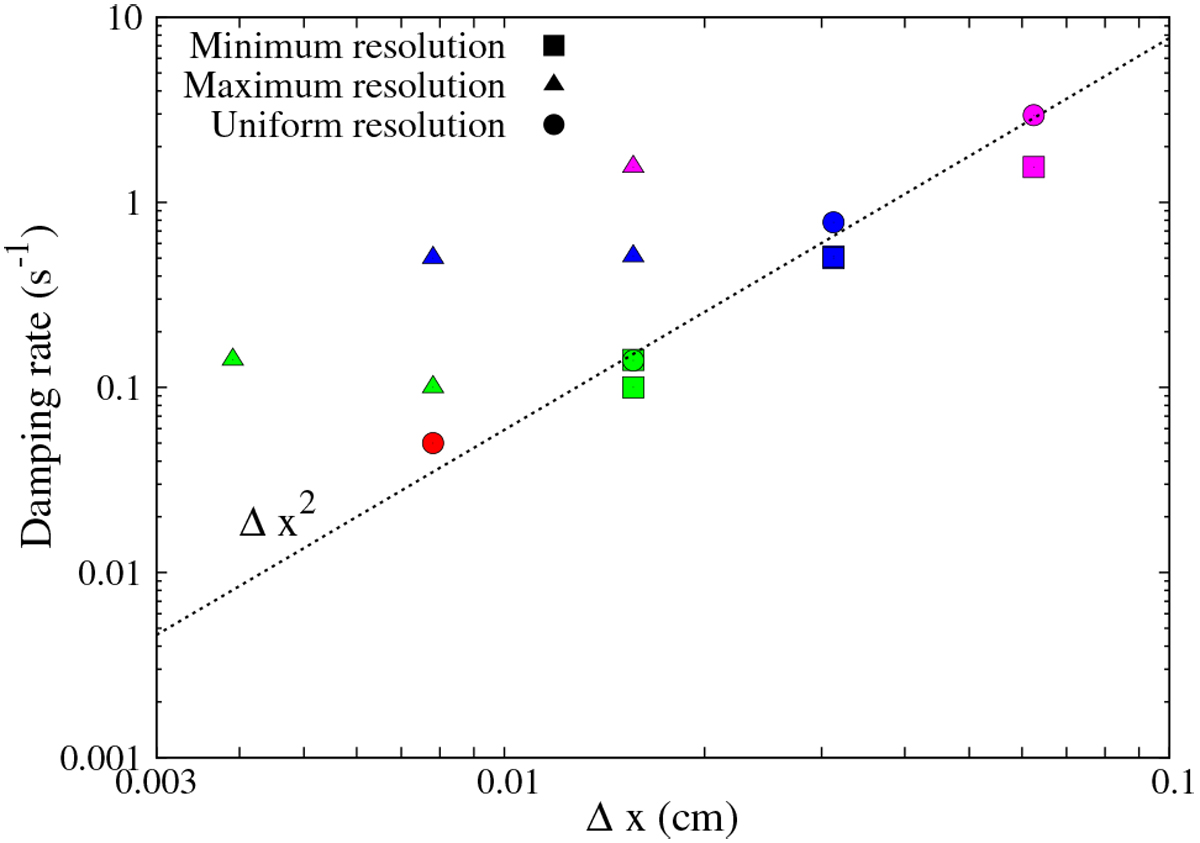
Damping coefficient of the whistler wave as a function of the maximum (triangles) and minimum (squares) resolution of the grid. Colors indicate the minimum resolution: purple for ℓmin = 4, blue for ℓmin = 5, green for ℓmin = 6, and red for ℓmin = 7. The circlepoints represent the regular grids, and the dashed line the least-squares fit of these points (∝ Δ x2.11).
Current usage metrics show cumulative count of Article Views (full-text article views including HTML views, PDF and ePub downloads, according to the available data) and Abstracts Views on Vision4Press platform.
Data correspond to usage on the plateform after 2015. The current usage metrics is available 48-96 hours after online publication and is updated daily on week days.
Initial download of the metrics may take a while.