Fig. B.1
Positive ![]() (solid lines) and negative
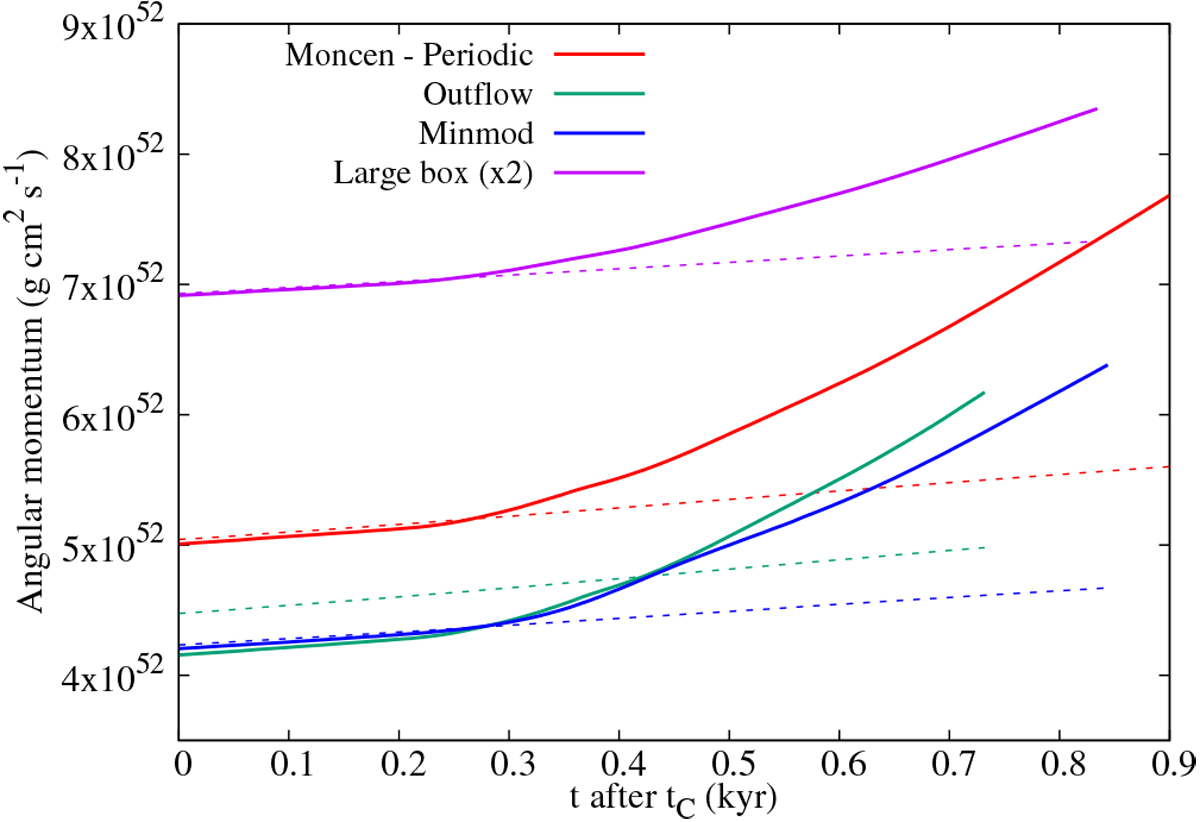
(solid lines) and negative ![]() (dashed lines) angular momentum evolution after the formation of the first Larson core for several variations of the reference case. Red curves: reference case (generalized moncen slope limiter and periodic boundary conditions), green curves: outflow boundary conditions, blue curves: minmod slope limiter, purple curves: simulation box twice as large. The value of the angular momentum has been divided by two for the latter to improve the readability of the graph.
(dashed lines) angular momentum evolution after the formation of the first Larson core for several variations of the reference case. Red curves: reference case (generalized moncen slope limiter and periodic boundary conditions), green curves: outflow boundary conditions, blue curves: minmod slope limiter, purple curves: simulation box twice as large. The value of the angular momentum has been divided by two for the latter to improve the readability of the graph.
Current usage metrics show cumulative count of Article Views (full-text article views including HTML views, PDF and ePub downloads, according to the available data) and Abstracts Views on Vision4Press platform.
Data correspond to usage on the plateform after 2015. The current usage metrics is available 48-96 hours after online publication and is updated daily on week days.
Initial download of the metrics may take a while.