Free Access
Fig. 18
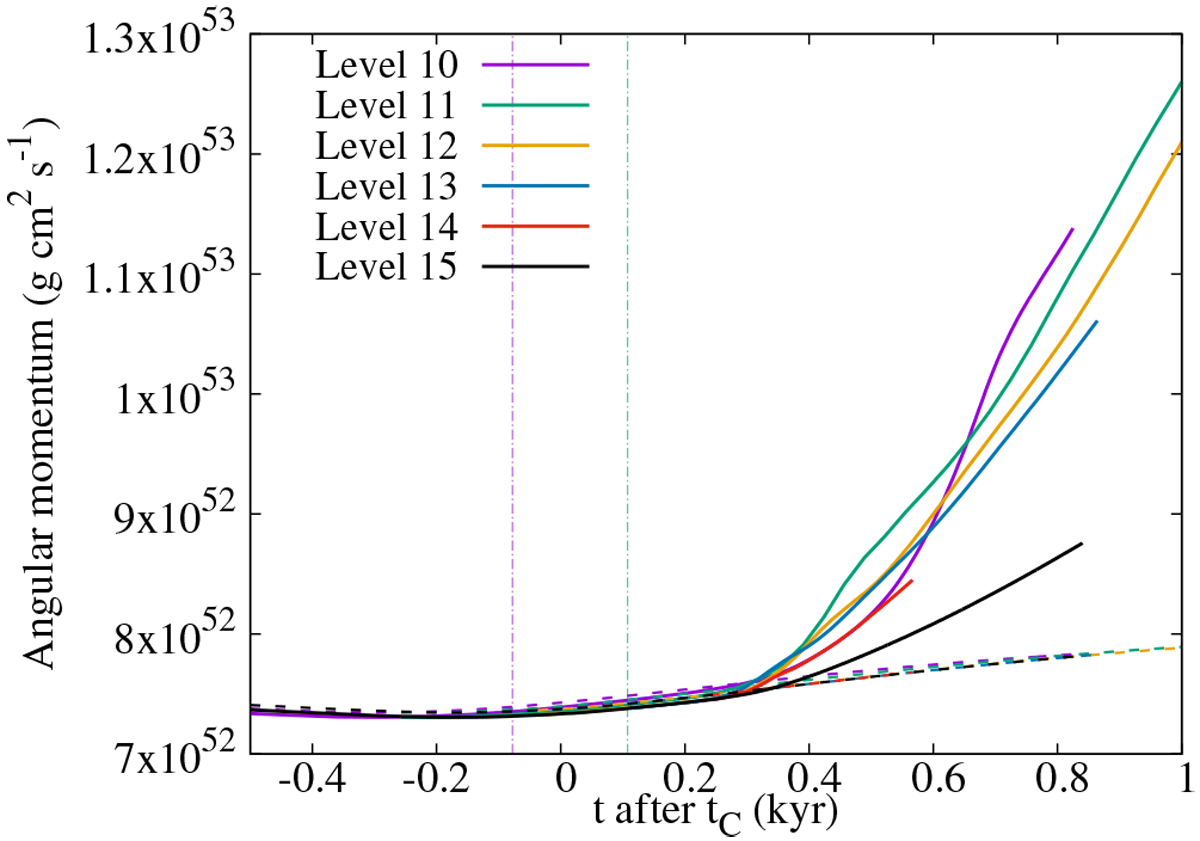
As top panel of Fig. 17, but comparing different maximum resolutions. The vertical bars show when the Truelove et al. (1997) condition is no longer verified for maximum resolution levels of 10 and 11. Please note that the level 15 line in black is the same as the blue curve in Fig. 17.
Current usage metrics show cumulative count of Article Views (full-text article views including HTML views, PDF and ePub downloads, according to the available data) and Abstracts Views on Vision4Press platform.
Data correspond to usage on the plateform after 2015. The current usage metrics is available 48-96 hours after online publication and is updated daily on week days.
Initial download of the metrics may take a while.