Free Access
Fig. 10
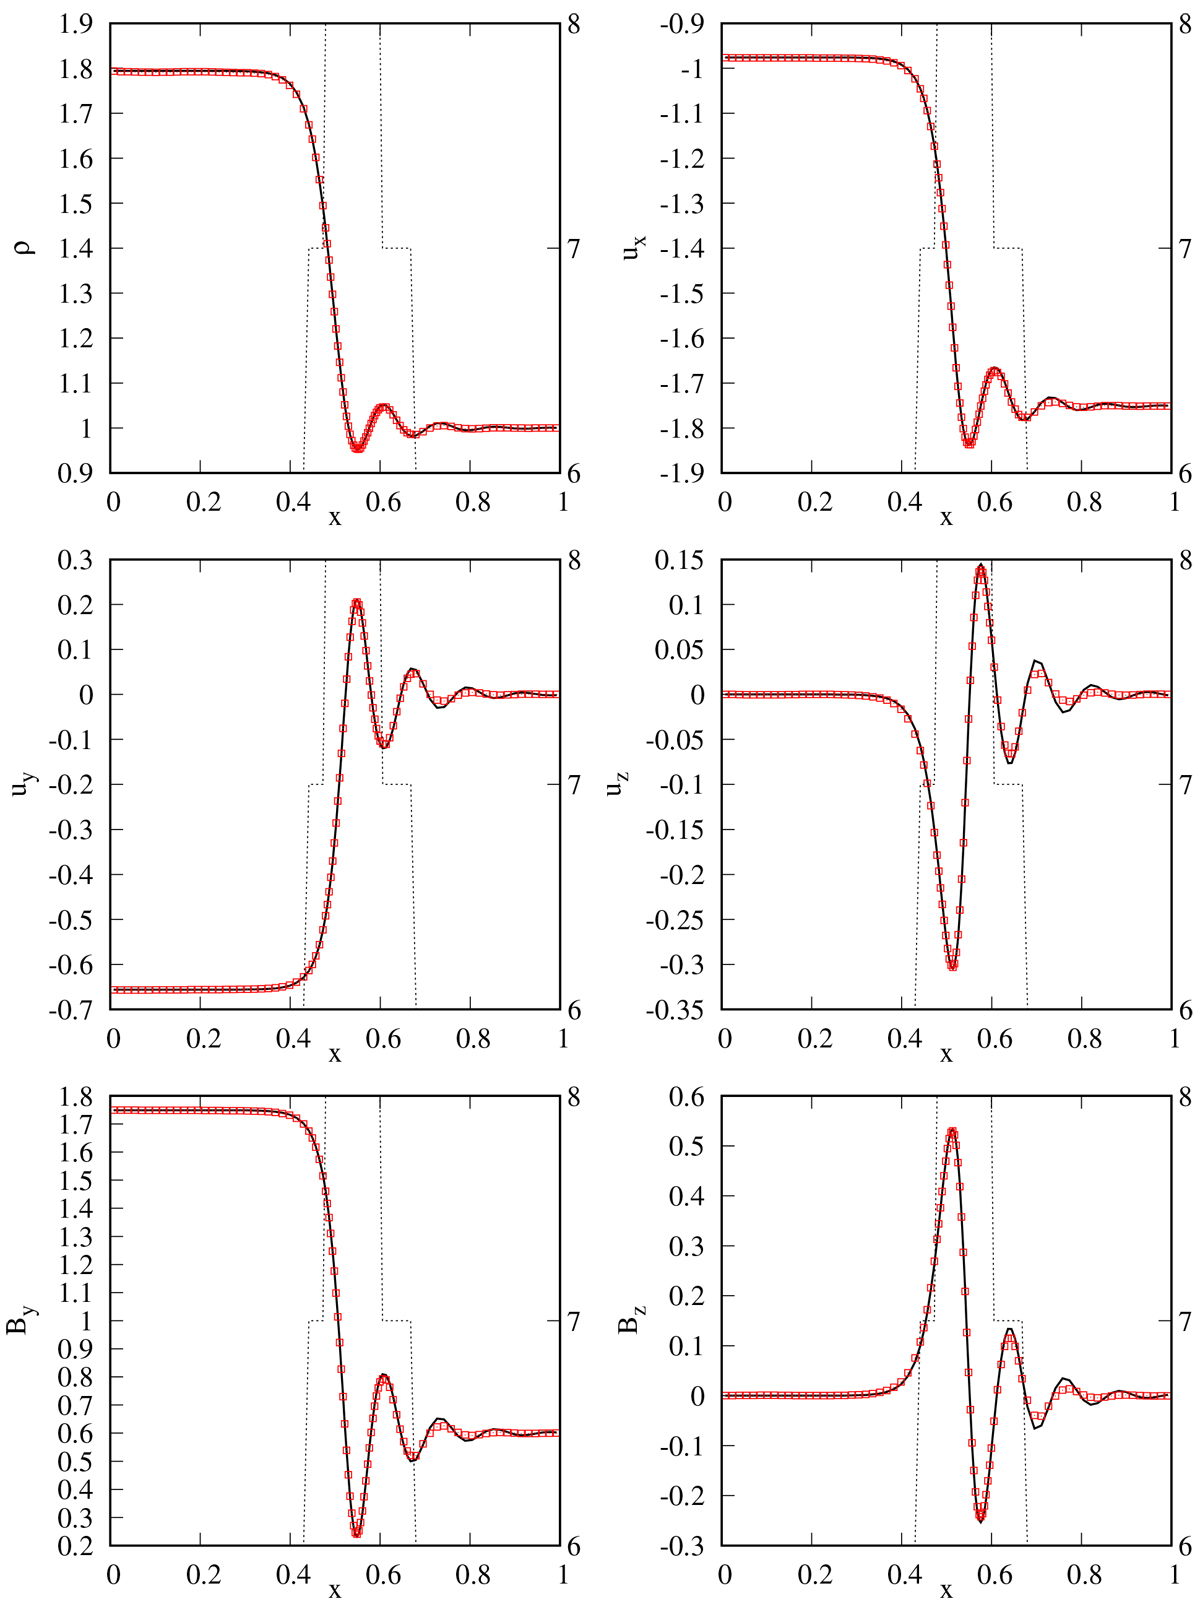
Comparison between the analytical solution of the standing shock (solid black line) and the numerical result (red squares). The AMR level is represented as the dashed black line (right axis). From top to bottom panels: ρ and ux, uy and uz, By and Bz.
Current usage metrics show cumulative count of Article Views (full-text article views including HTML views, PDF and ePub downloads, according to the available data) and Abstracts Views on Vision4Press platform.
Data correspond to usage on the plateform after 2015. The current usage metrics is available 48-96 hours after online publication and is updated daily on week days.
Initial download of the metrics may take a while.