Fig. A.1.
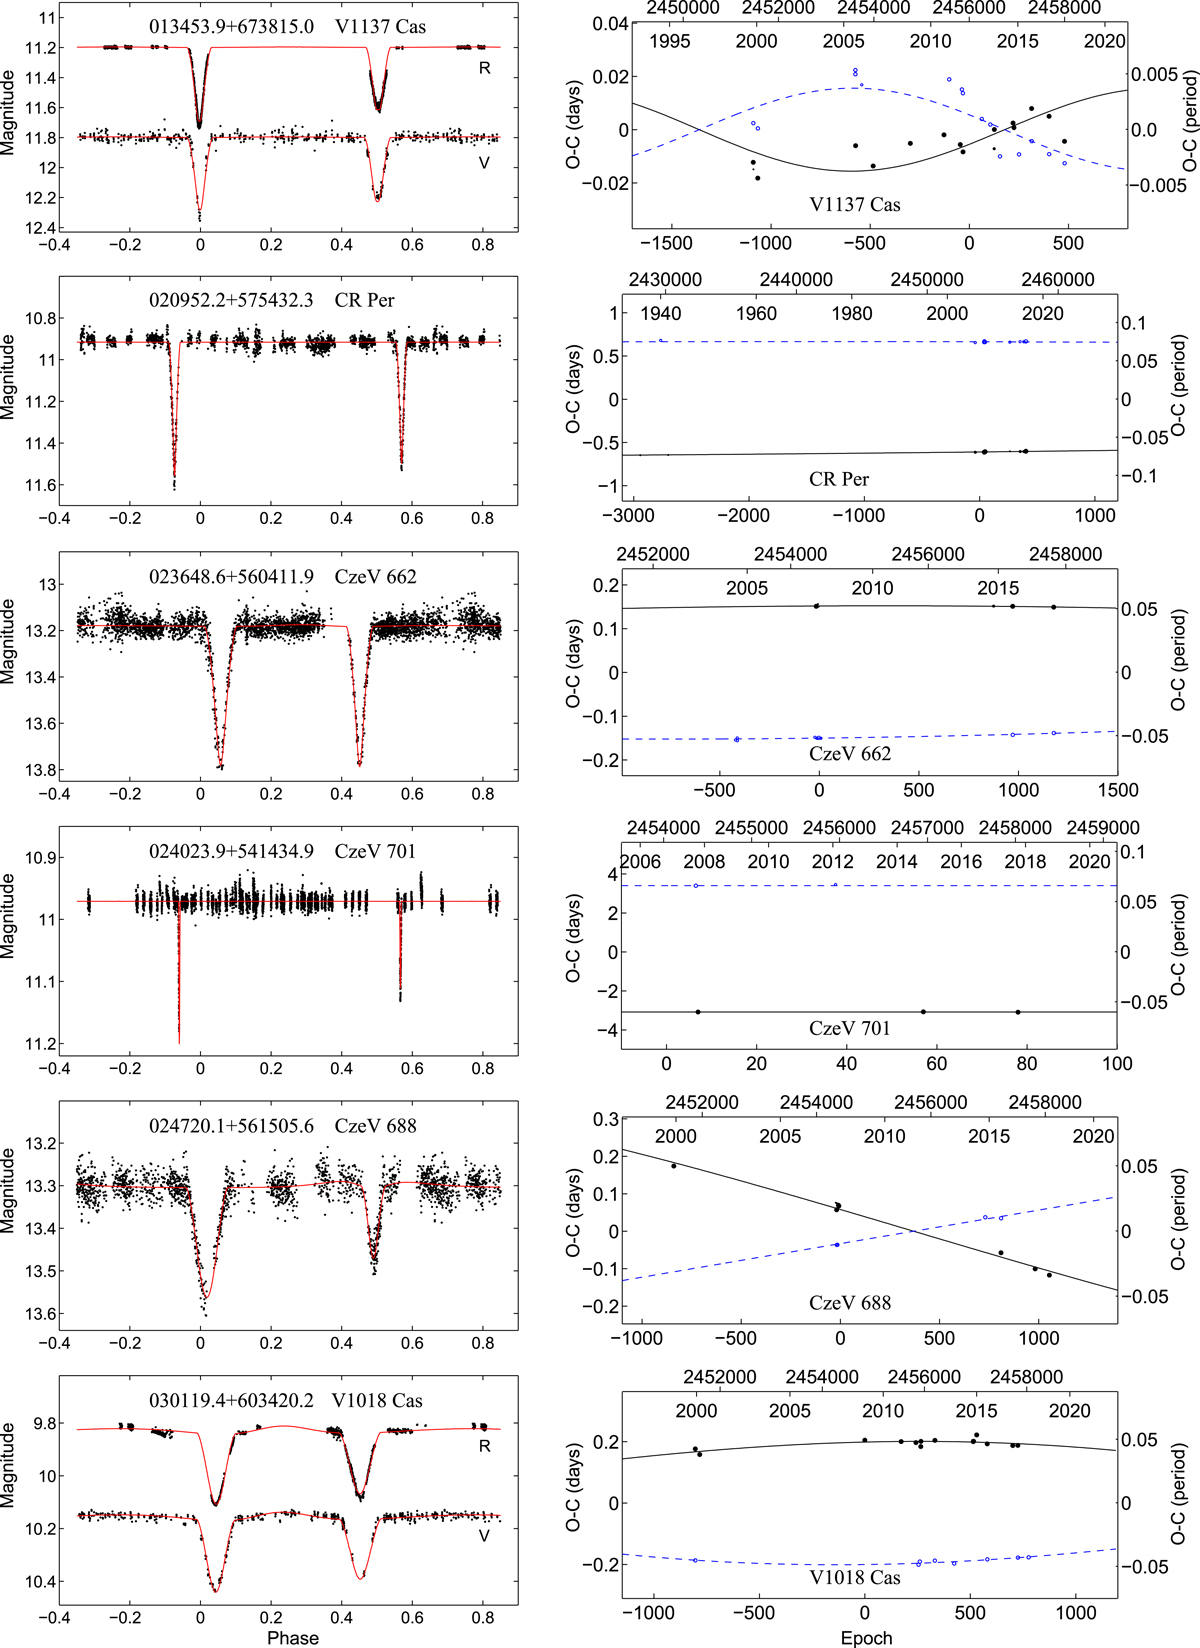
Light curves and O–C diagrams of the analysed systems. The small letters denote the individual filters for the particular light curve (standard notation, while “C” stands for unfiltered data and “S” indicates the special SuperWASP filter). For the O–C diagrams the full dots stand for the primary minima (as well as the solid line), while the open circles represent the secondary minima (and the dashed curve).
Current usage metrics show cumulative count of Article Views (full-text article views including HTML views, PDF and ePub downloads, according to the available data) and Abstracts Views on Vision4Press platform.
Data correspond to usage on the plateform after 2015. The current usage metrics is available 48-96 hours after online publication and is updated daily on week days.
Initial download of the metrics may take a while.