Free Access
Fig. 4.
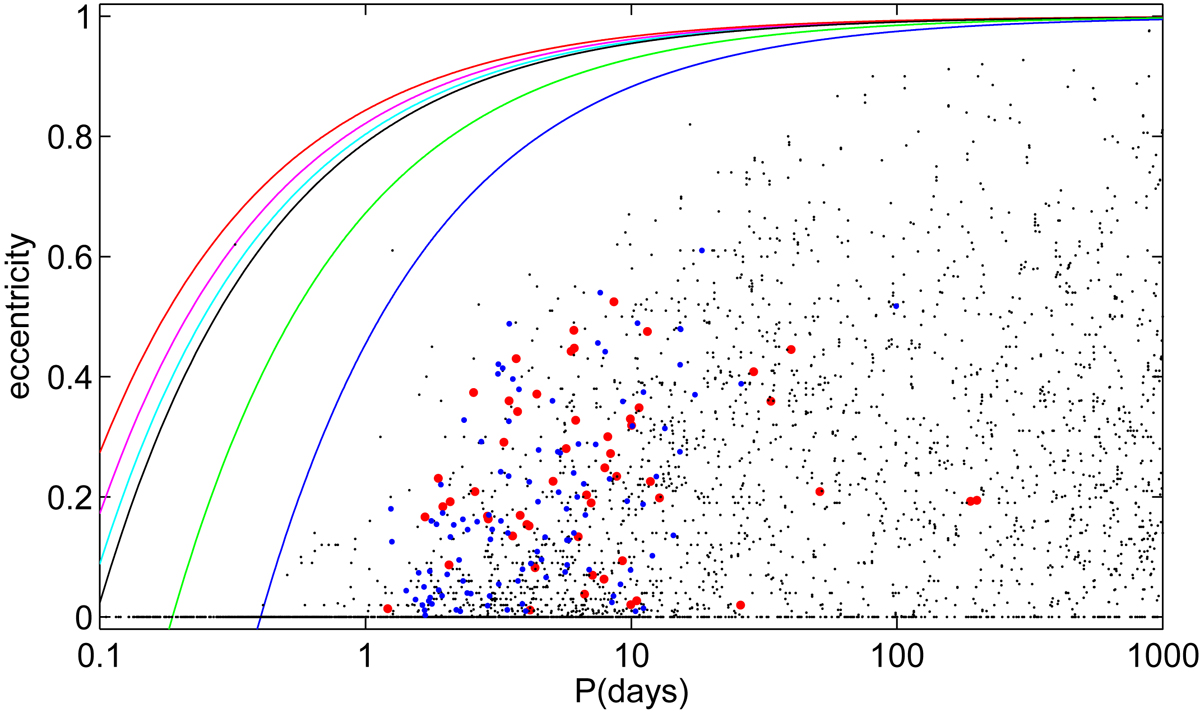
Distribution of known eccentric systems in the period-eccentricity diagram. New data are plotted in red, systems from the catalogue by Bulut & Demircan (2007) in blue, and spectroscopic binaries from the SB9 catalogue (Pourbaix et al. 2004) as small black points. See the text for detailed description of the solid lines.
Current usage metrics show cumulative count of Article Views (full-text article views including HTML views, PDF and ePub downloads, according to the available data) and Abstracts Views on Vision4Press platform.
Data correspond to usage on the plateform after 2015. The current usage metrics is available 48-96 hours after online publication and is updated daily on week days.
Initial download of the metrics may take a while.