Fig. 9.
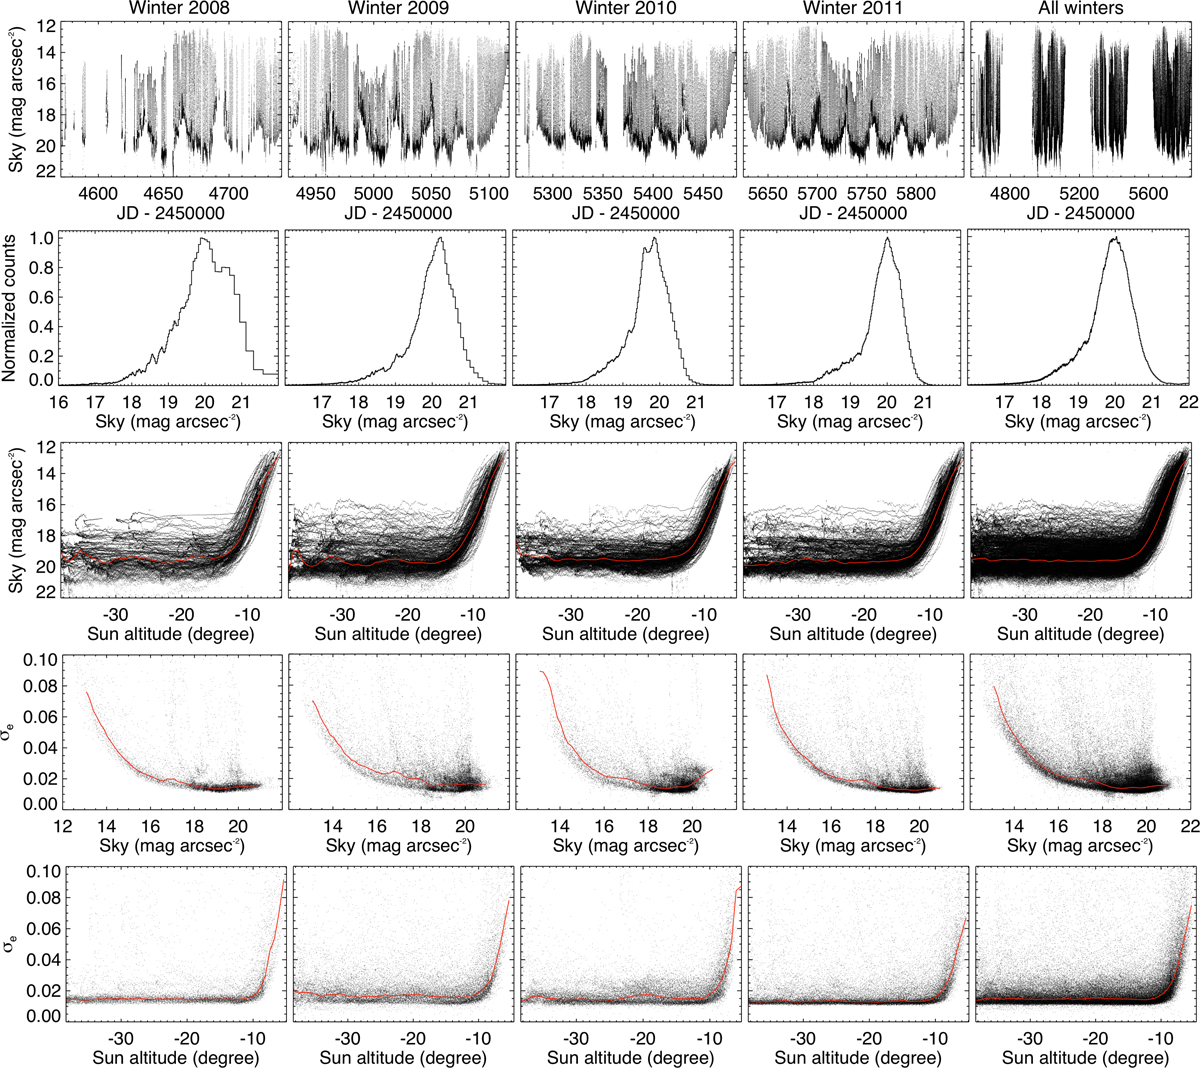
Sky background and related parameters for the winters 2008 to 2011 and for all the winters combined, from left to right. From top to bottom: sky background as a function of time, sky background distribution, sky background as a function of Sun altitude, epoch RMS σe (see text) as a function of sky background, and σe as a function of Sun altitude. The sky background histograms were calculated in flux units and are displayed in magnitude units. For the last three rows, we computed an outlier resistant mean using 50 bins across the abscissa range (red lines).
Current usage metrics show cumulative count of Article Views (full-text article views including HTML views, PDF and ePub downloads, according to the available data) and Abstracts Views on Vision4Press platform.
Data correspond to usage on the plateform after 2015. The current usage metrics is available 48-96 hours after online publication and is updated daily on week days.
Initial download of the metrics may take a while.