Free Access
Fig. 17.
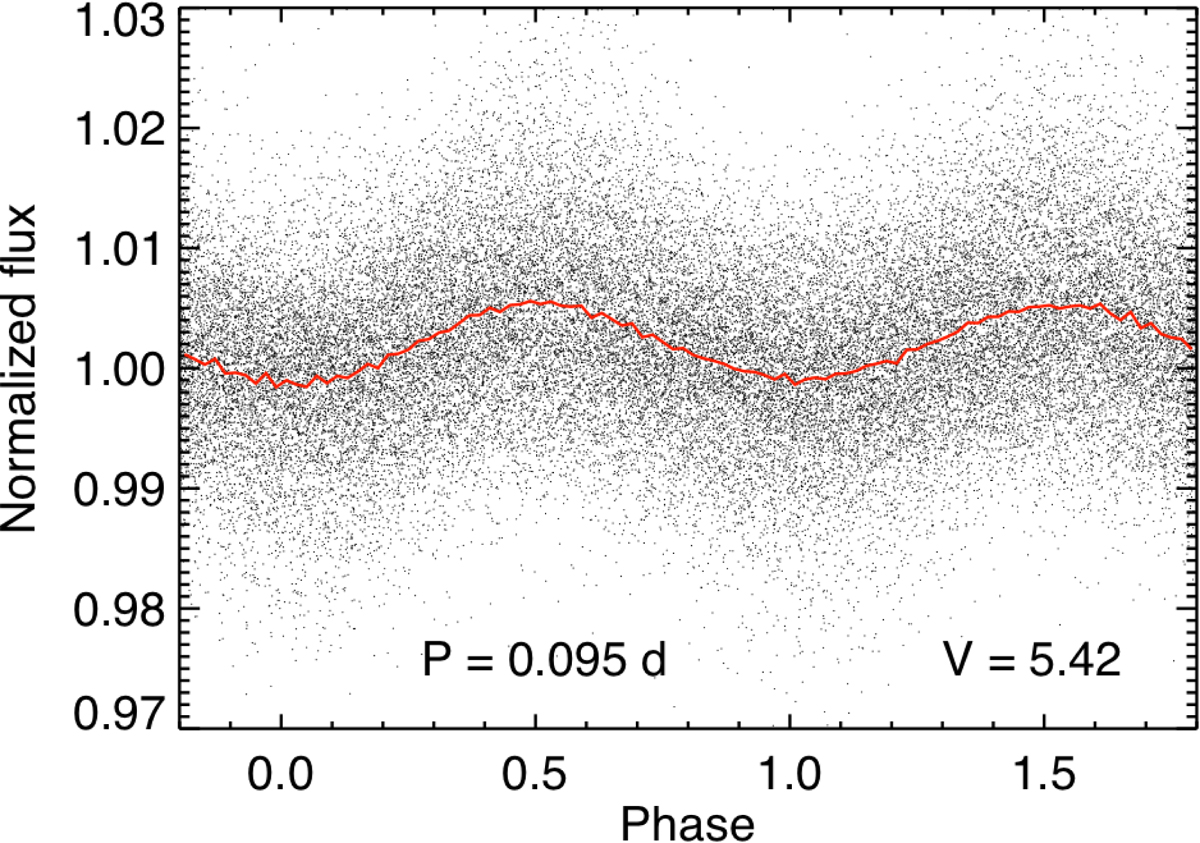
Lightcurve of σ Oct as observed with ASTEP South over four winters, phase-folded at a period of 0.0953 day. The black points correspond to a time sampling of 10 min. The red line is a binning with 100 points over the phase range. The period and V magnitude are indicated on the plot.
Current usage metrics show cumulative count of Article Views (full-text article views including HTML views, PDF and ePub downloads, according to the available data) and Abstracts Views on Vision4Press platform.
Data correspond to usage on the plateform after 2015. The current usage metrics is available 48-96 hours after online publication and is updated daily on week days.
Initial download of the metrics may take a while.