Fig. 15.
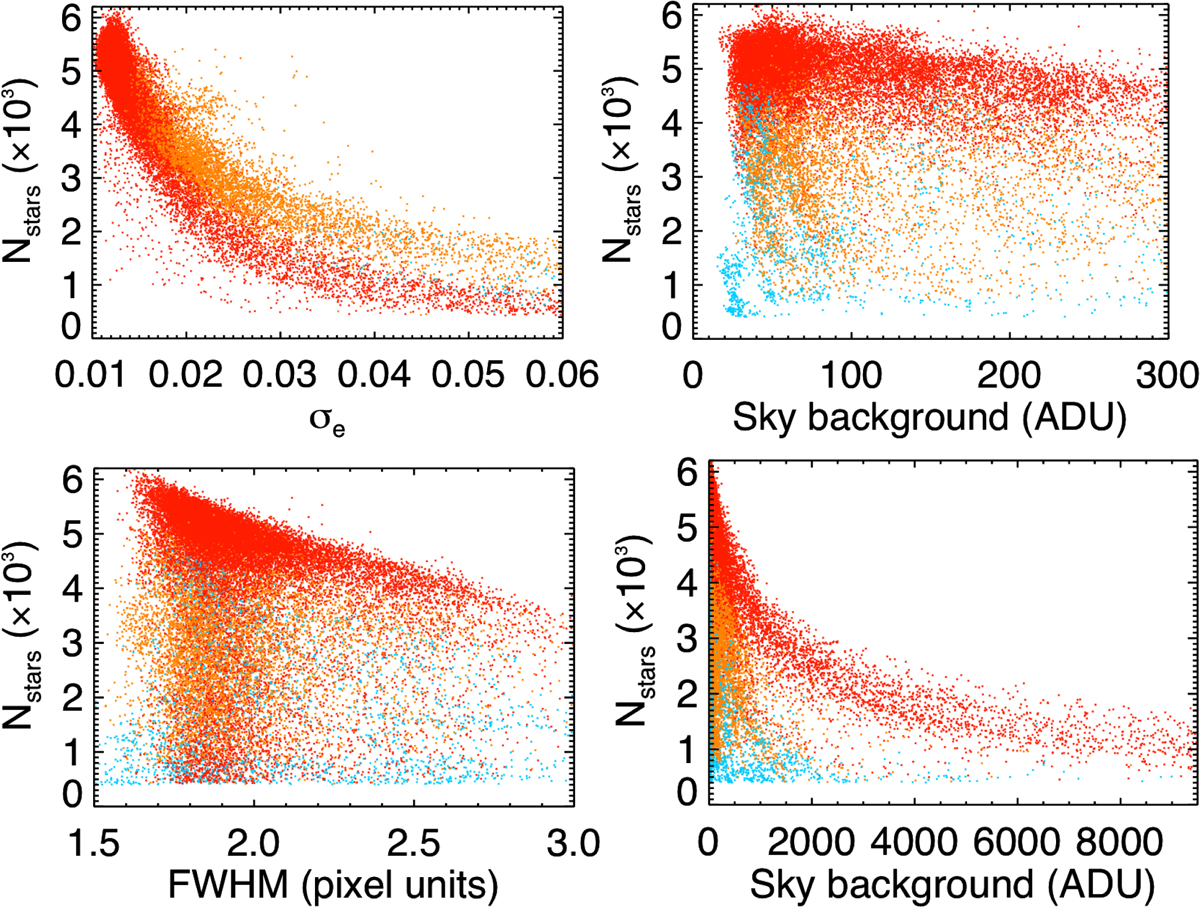
Correlations of the number of detected stars with σe (top left), the FWHM (top right), and the sky background (bottom left and right, in two different scales) for the 2011 winter. Photometric and veiled epochs as inferred from our model are indicated in red and orange, respectively. Bad epochs are indicated in blue; most of them do not have a calculated σe.
Current usage metrics show cumulative count of Article Views (full-text article views including HTML views, PDF and ePub downloads, according to the available data) and Abstracts Views on Vision4Press platform.
Data correspond to usage on the plateform after 2015. The current usage metrics is available 48-96 hours after online publication and is updated daily on week days.
Initial download of the metrics may take a while.