Fig. 6.
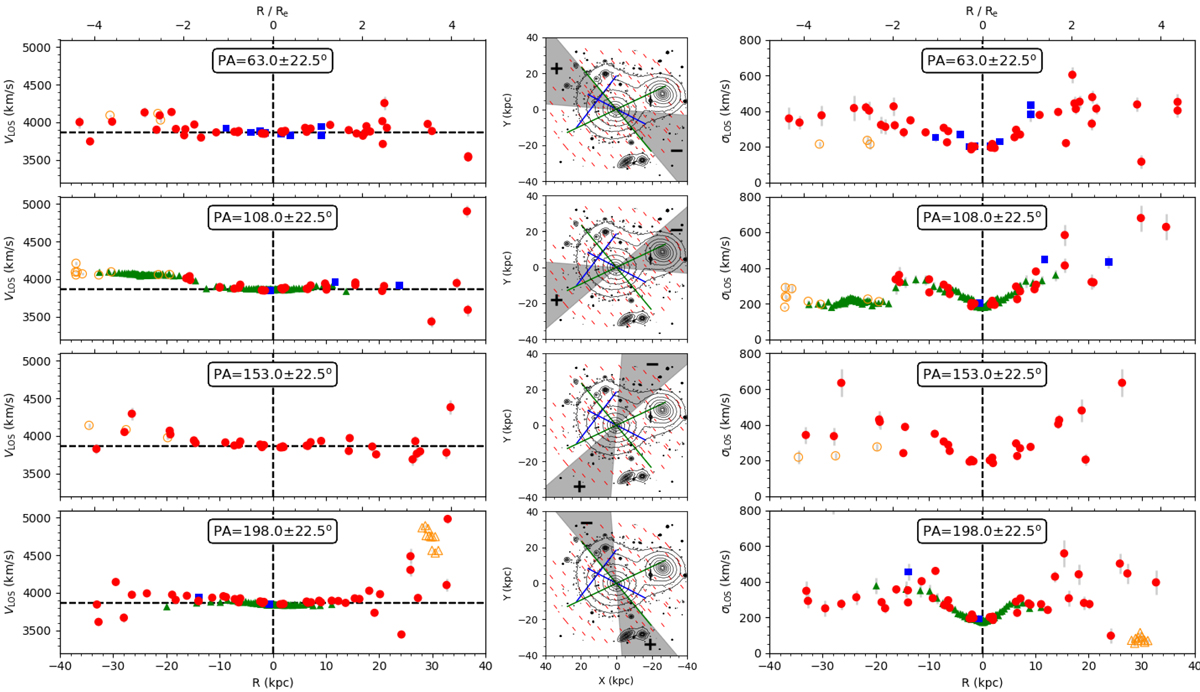
Left panels: line-of-sight velocity as function of galactocentric distance in kpc from NGC 3311 for four conic segments. Red dots and orange open symbols are our measurements, blue squares and green triangles those from long-slit data of Ventimiglia et al. (2010) and Richtler et al. (2011). The orange circles are measurements dominated by the light of NGC 3309, open triangles those of HCC 007. The position angles, PA (north over east) are indicated as legend in the panels. The horizontal dashed line indicates the systemic velocity of NGC 3311 of 3850 km s−1. Middle panels: grey areas show the cones, in which slits have been selected for the left and right plots. Right panels: same as left but for the line-of-sight velocity dispersion. In the left and right panels the distance in units of effective radii is given on the top label. We note that a positive distance in the x-axis of these panels refers to the direction of the position angles as indicated in the plots (north over east), the negative x-axis refers to the opposite PA direction). The axes description of the middle panels are distances in RA and Dec (positive towards north and east, negative towards south and west). The directions of the radial distances along the cones shown in the left and right panels are indicated as black “+” and “−” signs.
Current usage metrics show cumulative count of Article Views (full-text article views including HTML views, PDF and ePub downloads, according to the available data) and Abstracts Views on Vision4Press platform.
Data correspond to usage on the plateform after 2015. The current usage metrics is available 48-96 hours after online publication and is updated daily on week days.
Initial download of the metrics may take a while.