Table 3.
Mutual relation of emission features for the active region set.
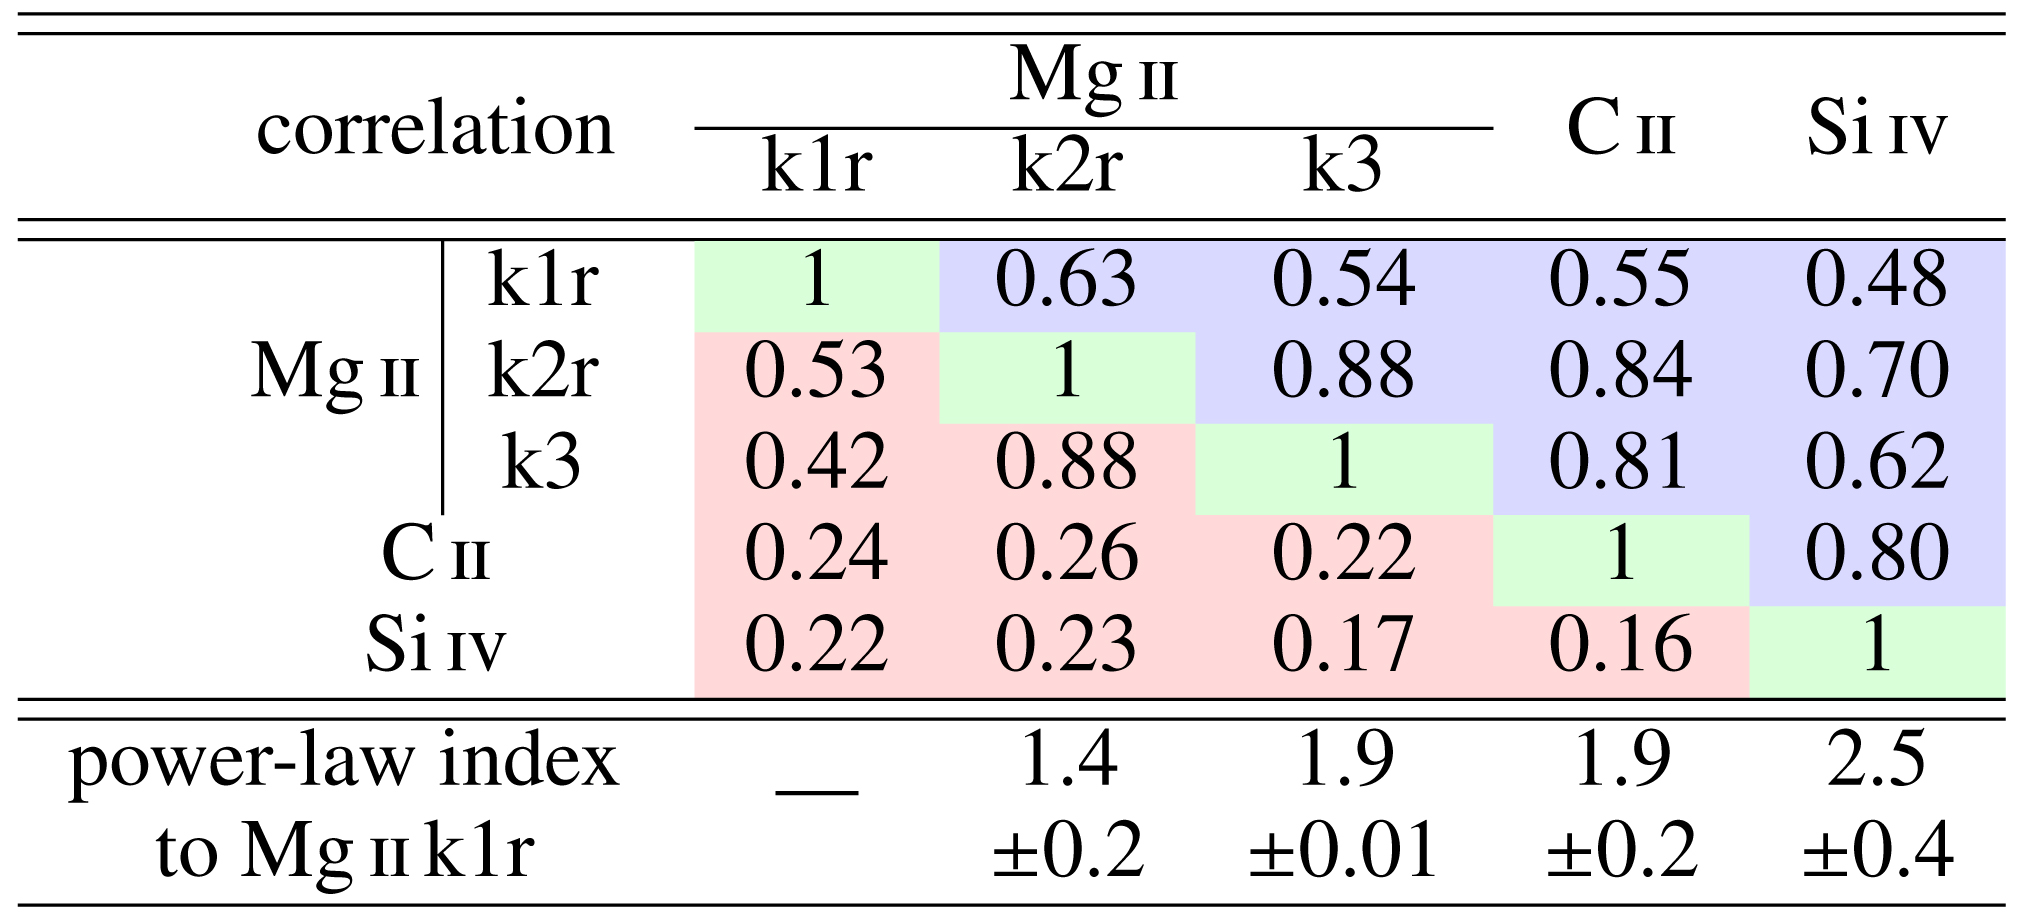
Notes. The Spearman’s Rank order correlation coefficients are presented in the blue part, the cross-correlation coefficients in the red part. The correlation coefficients are based on the raster images at the original IRIS spatial resolution without the subtraction of the basal flux. See Sect. 3.3.1 for the correlation coefficients and Sect. 3.3.2 for the power-law indices.
Current usage metrics show cumulative count of Article Views (full-text article views including HTML views, PDF and ePub downloads, according to the available data) and Abstracts Views on Vision4Press platform.
Data correspond to usage on the plateform after 2015. The current usage metrics is available 48-96 hours after online publication and is updated daily on week days.
Initial download of the metrics may take a while.