Fig. 8.
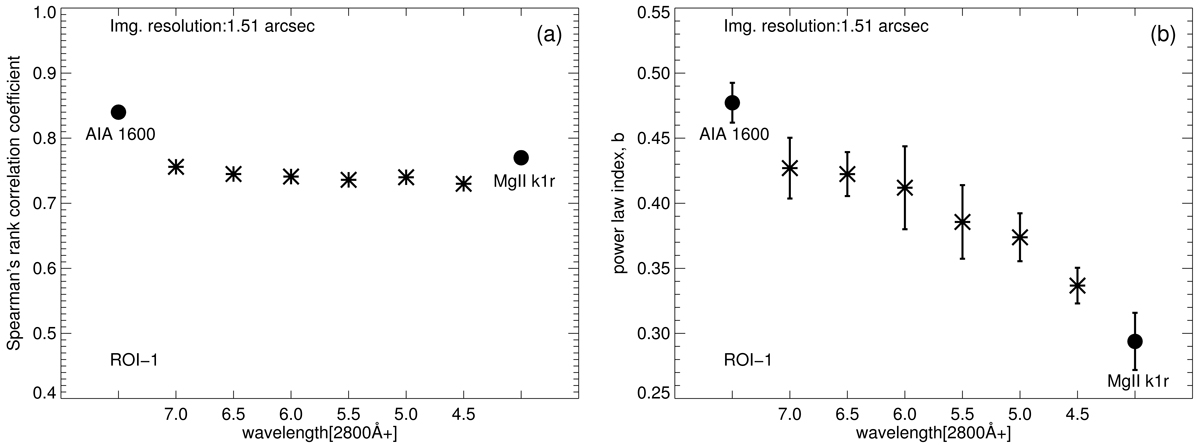
Variation of correlation coefficients and power-law indices from photosphere to temperature minimum. Using the Mg II wing this plot fills the gap between the formation region of AIA 1600 Å and Mg II k1r in Figs. 5 and 7. Panel a: Spearman correlation and Panel b: power-law index of the relation of the emission to the magnetic field. The asterisks show results based on the emission in 0.5 Å wide bands in the red wing of Mg II h. The formation height increases with decreasing wavelength (i.e. to the right). These data are based on the active region set with a spatial scale of 1.5″, thus the black filled circles show the same data points as the black filled circles for AIA 1600 Å and Mg II k1r in Figs. 5 and 7. See Sect. 5.2.
Current usage metrics show cumulative count of Article Views (full-text article views including HTML views, PDF and ePub downloads, according to the available data) and Abstracts Views on Vision4Press platform.
Data correspond to usage on the plateform after 2015. The current usage metrics is available 48-96 hours after online publication and is updated daily on week days.
Initial download of the metrics may take a while.