Fig. 7.
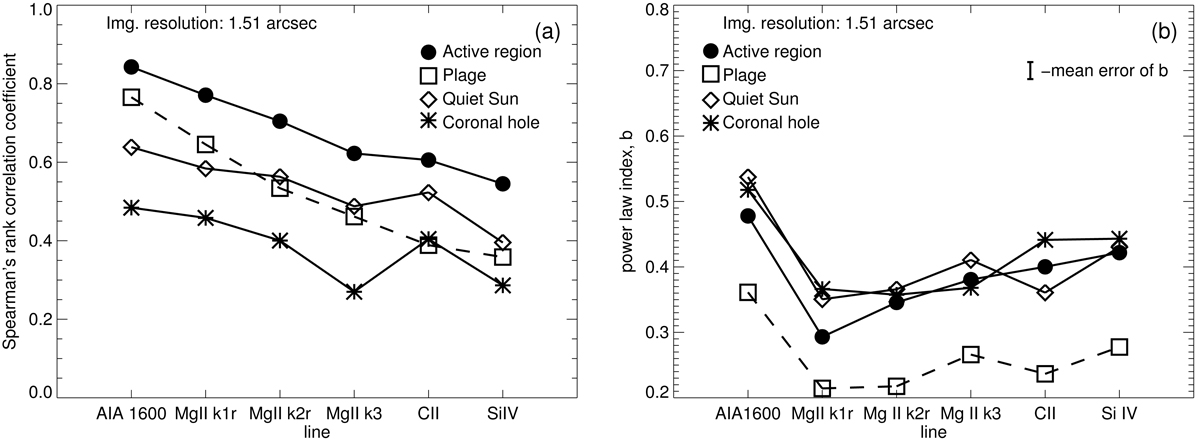
Relation of the upper atmosphere to the underlying magnetic field in different parts of the Sun. This figure is similar to Fig. 5, but for a spatial scale of 1.5″ per pixel for the four regions of interest as defined in Sect. 2.3. Panel a: Spearman correlation to the (underlying) magnetic field and Panel b: power-law index of the power law fit of emission feature vs. magnetic field. The curves for active region (solid with filled dots) are identical to the respective black curves in Fig. 5. See Sects. 4.2–4.3.
Current usage metrics show cumulative count of Article Views (full-text article views including HTML views, PDF and ePub downloads, according to the available data) and Abstracts Views on Vision4Press platform.
Data correspond to usage on the plateform after 2015. The current usage metrics is available 48-96 hours after online publication and is updated daily on week days.
Initial download of the metrics may take a while.