Fig. 5.
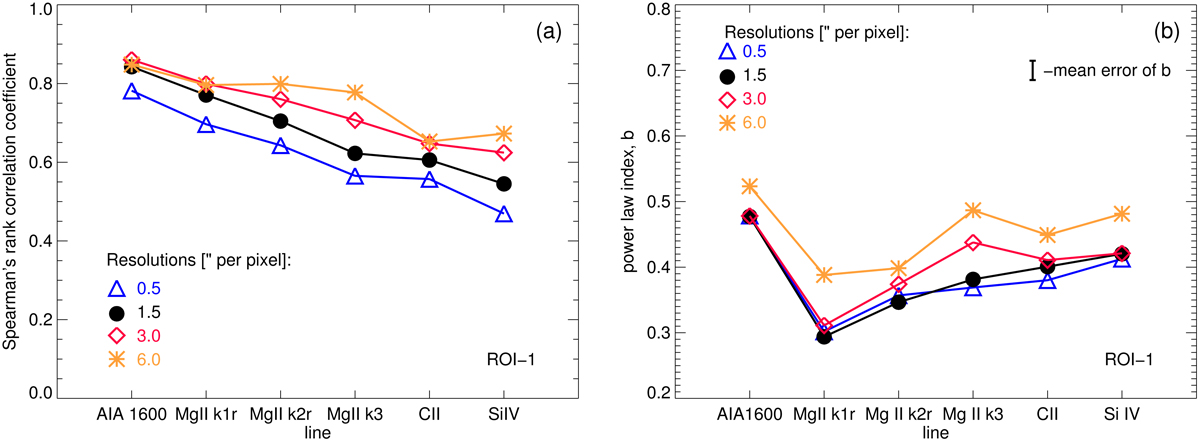
Relation of the upper atmosphere to the underlying magnetic field for the active region set. Panel a: Spearman correlation of the various emission features to the photospheric magnetic field, Panel b: power-law index from the power-law fit of the relation of emission to magnetic field. The emission features are ordered according to the approximate formation temperature (cf. Table 2). The different colours show the results based on data at different spatial resolutions, here represented by plate scales from 0.5″ to 6″ per pixel. See Sect. 4.1.1.
Current usage metrics show cumulative count of Article Views (full-text article views including HTML views, PDF and ePub downloads, according to the available data) and Abstracts Views on Vision4Press platform.
Data correspond to usage on the plateform after 2015. The current usage metrics is available 48-96 hours after online publication and is updated daily on week days.
Initial download of the metrics may take a while.