Fig. 4.
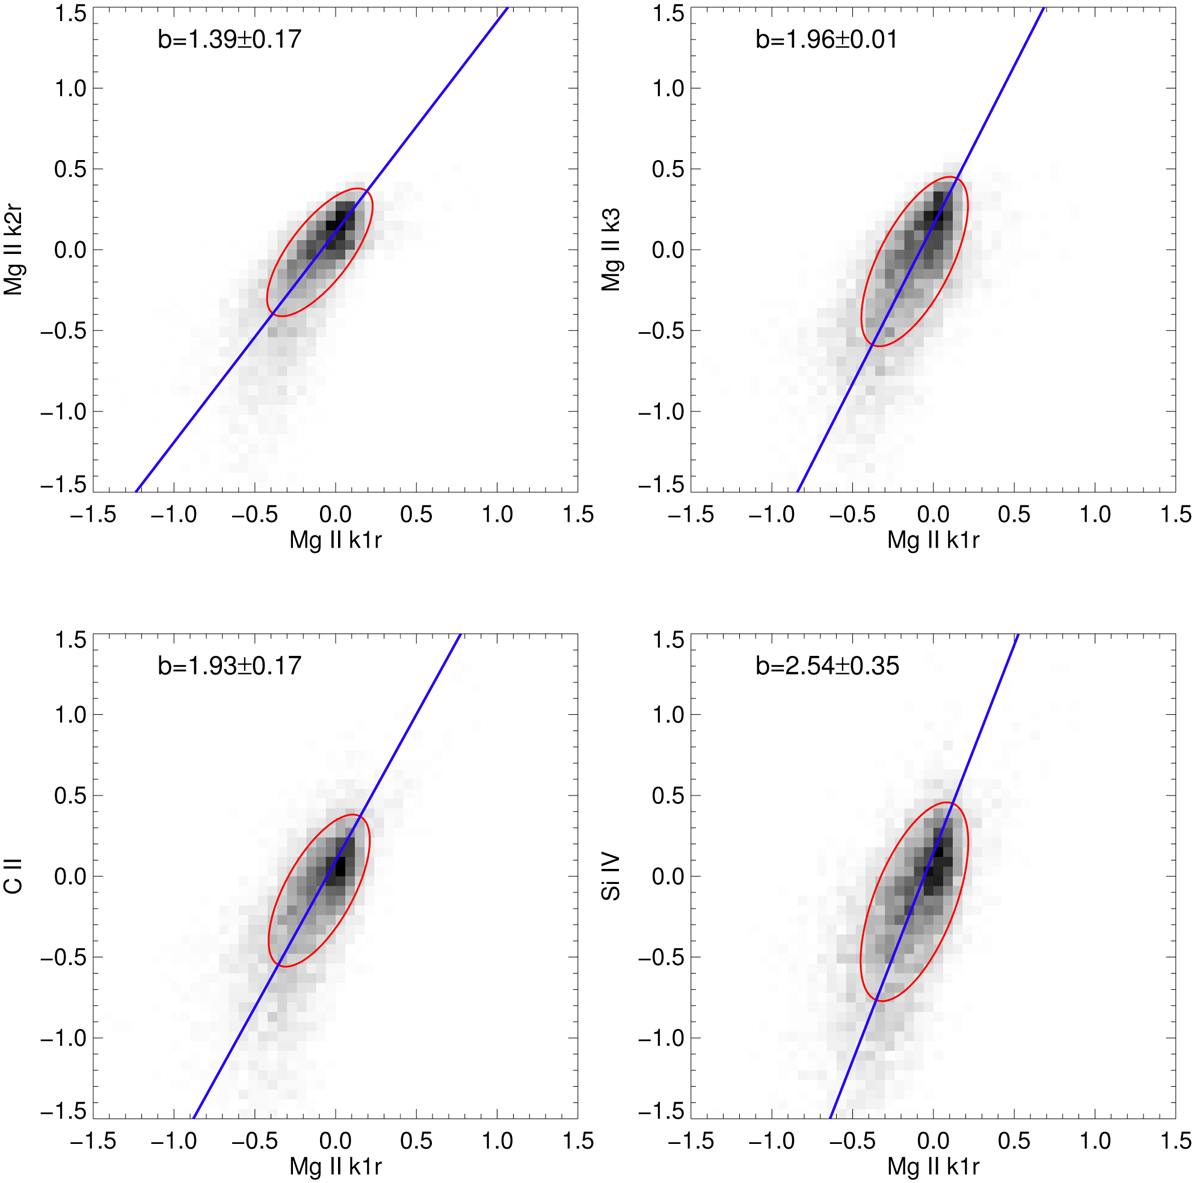
Probability density functions (PDFs) for the flux–flux relation for the active region set for a spatial resolution of 1.5″. Here the respective basal fluxes are subtracted. The intensities are normalised to the respective median value and are plotted on a logarithmic scale. The red ellipses show the fit to the contour level at 1.5 × FWHM. The blue lines indicate the power-law-slopes calculated as the average from the ellipse fits of the contour levels at [1,1.5,2] × FWHM. See Sect. 3.3.2
Current usage metrics show cumulative count of Article Views (full-text article views including HTML views, PDF and ePub downloads, according to the available data) and Abstracts Views on Vision4Press platform.
Data correspond to usage on the plateform after 2015. The current usage metrics is available 48-96 hours after online publication and is updated daily on week days.
Initial download of the metrics may take a while.