Fig. 3.
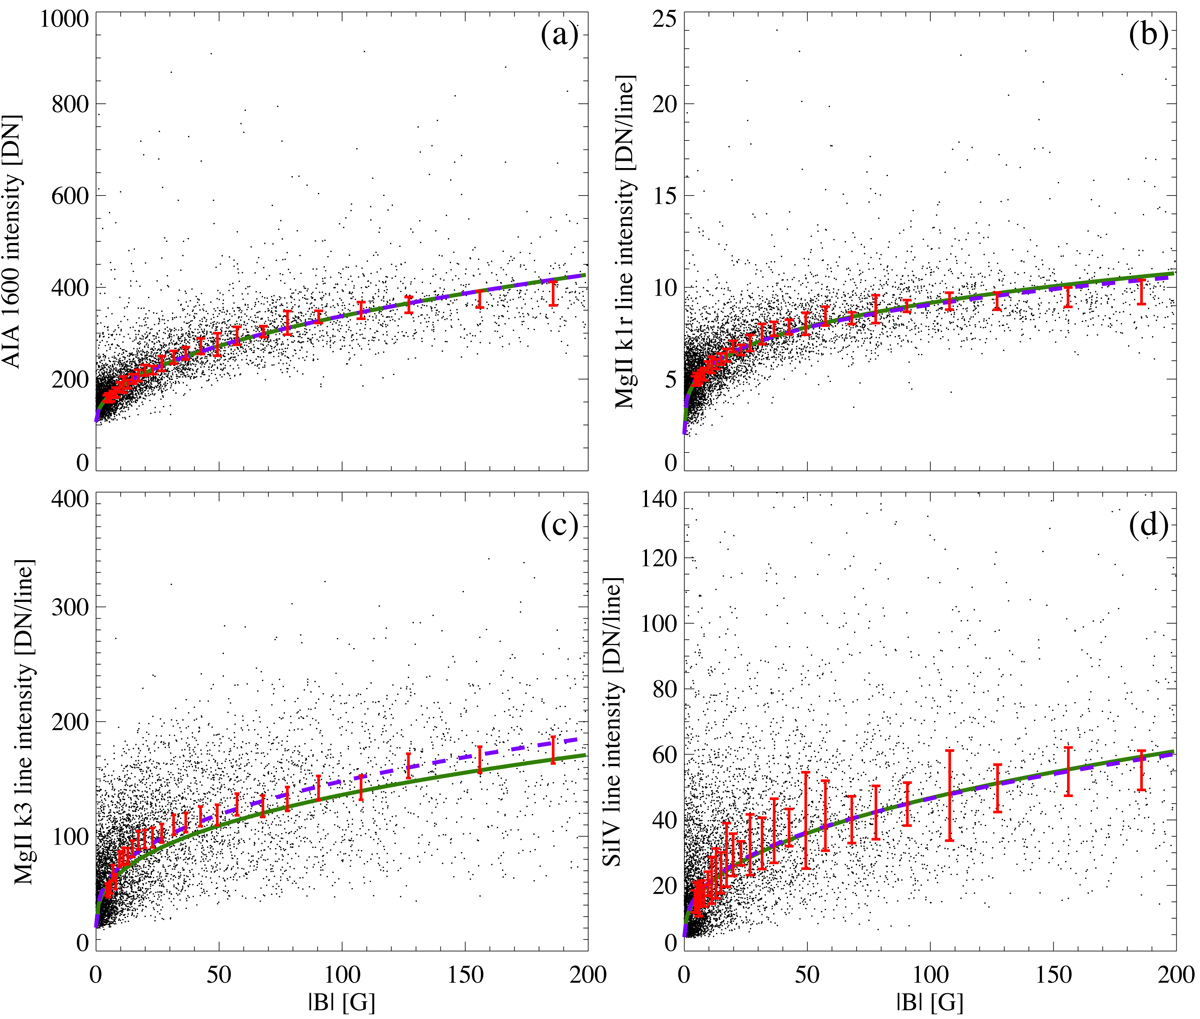
Relation of upper atmosphere emission to the magnetic field. While we prepared these plots to calculate correlations and power-law-fits for all emission features listed in Table 2, for brevity we plot here only the relations involving (panel a) AIA 1600 Å, (panel b) Mg II k1r, (panel c) Mg II k3, and (panel d)Si IV. The power-law functions fitted to all data points are represented by (green) solid curves. The red bars indicate the intensity in bins in magnetic field strength |B|, into which we grouped equal numbers of data points (here 200). The height of each bar represents three times the standard error in each bin. The blue dashed curves show power-law-fits to the binned data. The data shown in these examples are for the active region set as defined in Sect. 2.3 (red rectangle without yellow rectangles in Fig. 2). The same data are plotted in Fig. B.1 on a double-logarithmic scale. See Sects. 3.2.1 and 3.2.2.
Current usage metrics show cumulative count of Article Views (full-text article views including HTML views, PDF and ePub downloads, according to the available data) and Abstracts Views on Vision4Press platform.
Data correspond to usage on the plateform after 2015. The current usage metrics is available 48-96 hours after online publication and is updated daily on week days.
Initial download of the metrics may take a while.