Fig. 2.
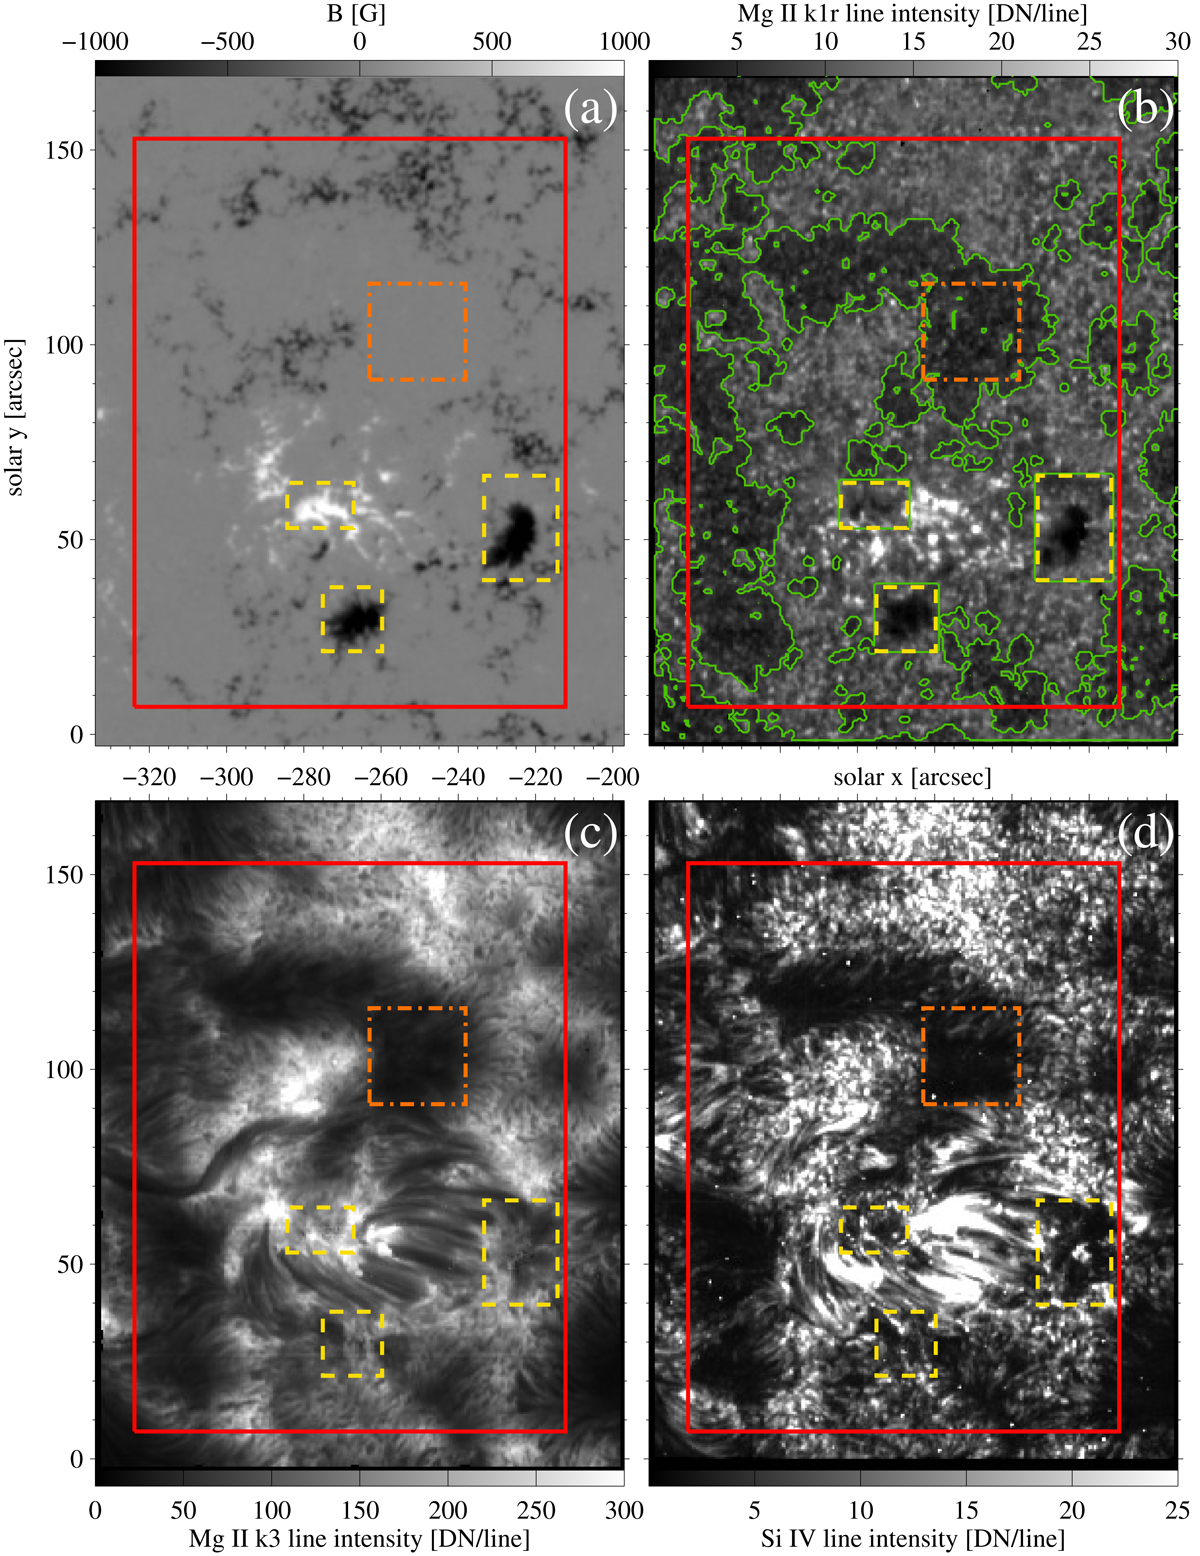
Active region from IRIS raster scan and magnetic field context from HMI. The images display the active region 11850 (cf. Table 1). Panel a: the SDO/HMI line-of-sight magnetogram and the raster maps by IRIS in (panel b)Mg II k1r, (panel c)Mg II k3, and (panel d)Si IV. The lines and contours highlight the regions used to define the active region and plage areas (see Sect. 2.3). The three yellow rectangles indicate the location of pores and sunspots, the large red rectangle the full extent of the active region. The green contours (only in panel b) show the location of the plage area. The threshold for the definition of the plage area was calculated in the orange rectangle indicating a quiet region.
Current usage metrics show cumulative count of Article Views (full-text article views including HTML views, PDF and ePub downloads, according to the available data) and Abstracts Views on Vision4Press platform.
Data correspond to usage on the plateform after 2015. The current usage metrics is available 48-96 hours after online publication and is updated daily on week days.
Initial download of the metrics may take a while.