Fig. 5.
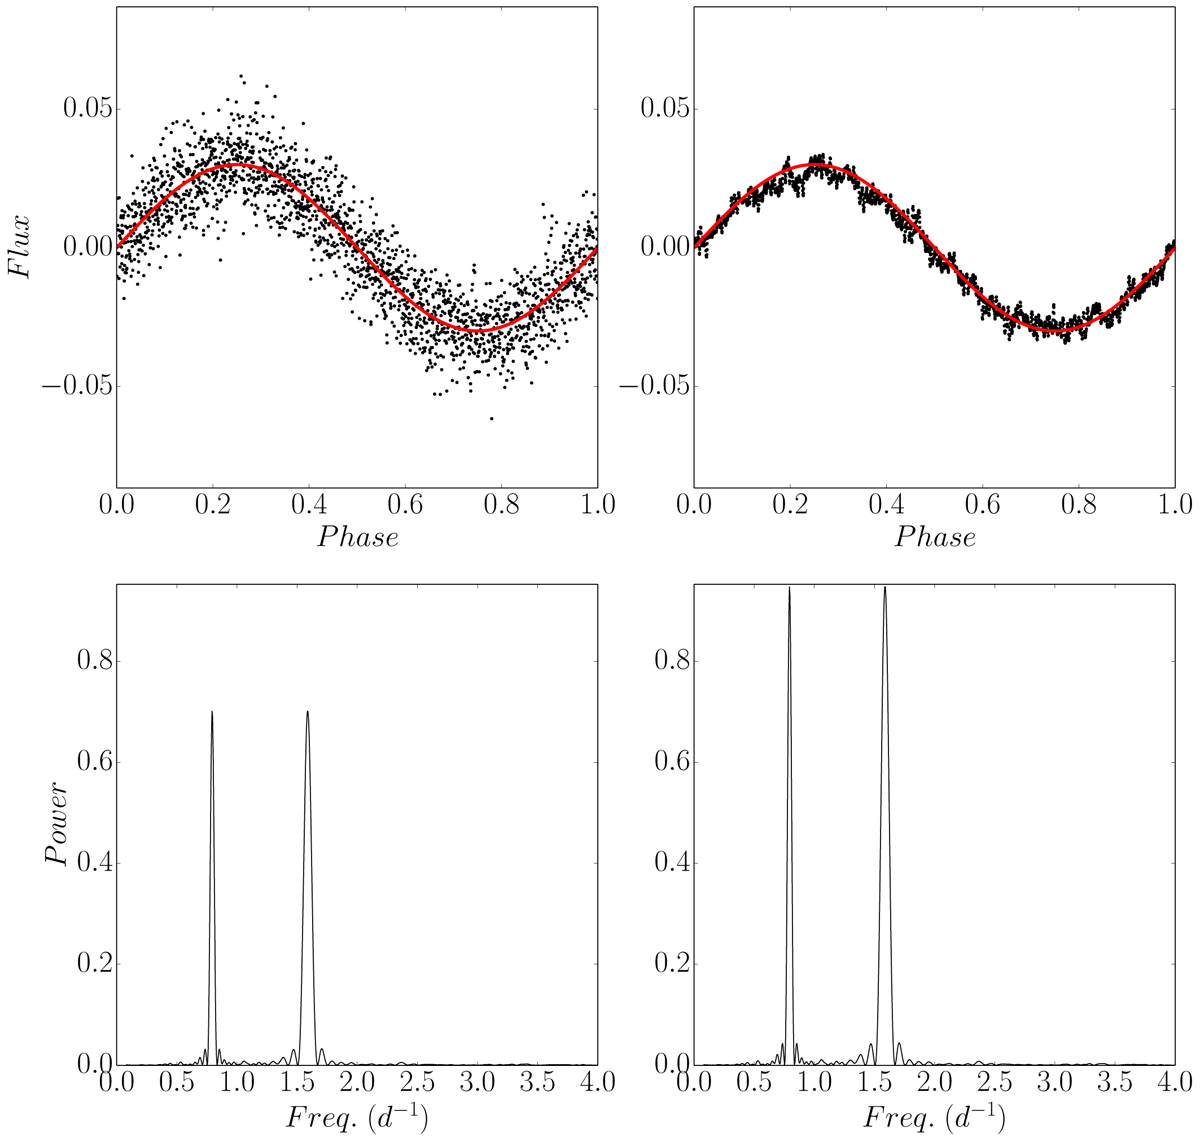
Noise-filtering comparison of a simulated sinusoidal signal. The same number of template stars and LS parameters were used for TFA and TFAW. Top left: TFA-detrended and reconstructed phase folded signal. Red line corresponds to the simulated signal. Top right: same phase folded signal but TFAW-detrended, reconstructed and denoised. Bottom left: LS power spectrum of TFA frequency analysis step. Bottom right: LS power spectrum of TFAW frequency analysis step.
Current usage metrics show cumulative count of Article Views (full-text article views including HTML views, PDF and ePub downloads, according to the available data) and Abstracts Views on Vision4Press platform.
Data correspond to usage on the plateform after 2015. The current usage metrics is available 48-96 hours after online publication and is updated daily on week days.
Initial download of the metrics may take a while.