Fig. 16.
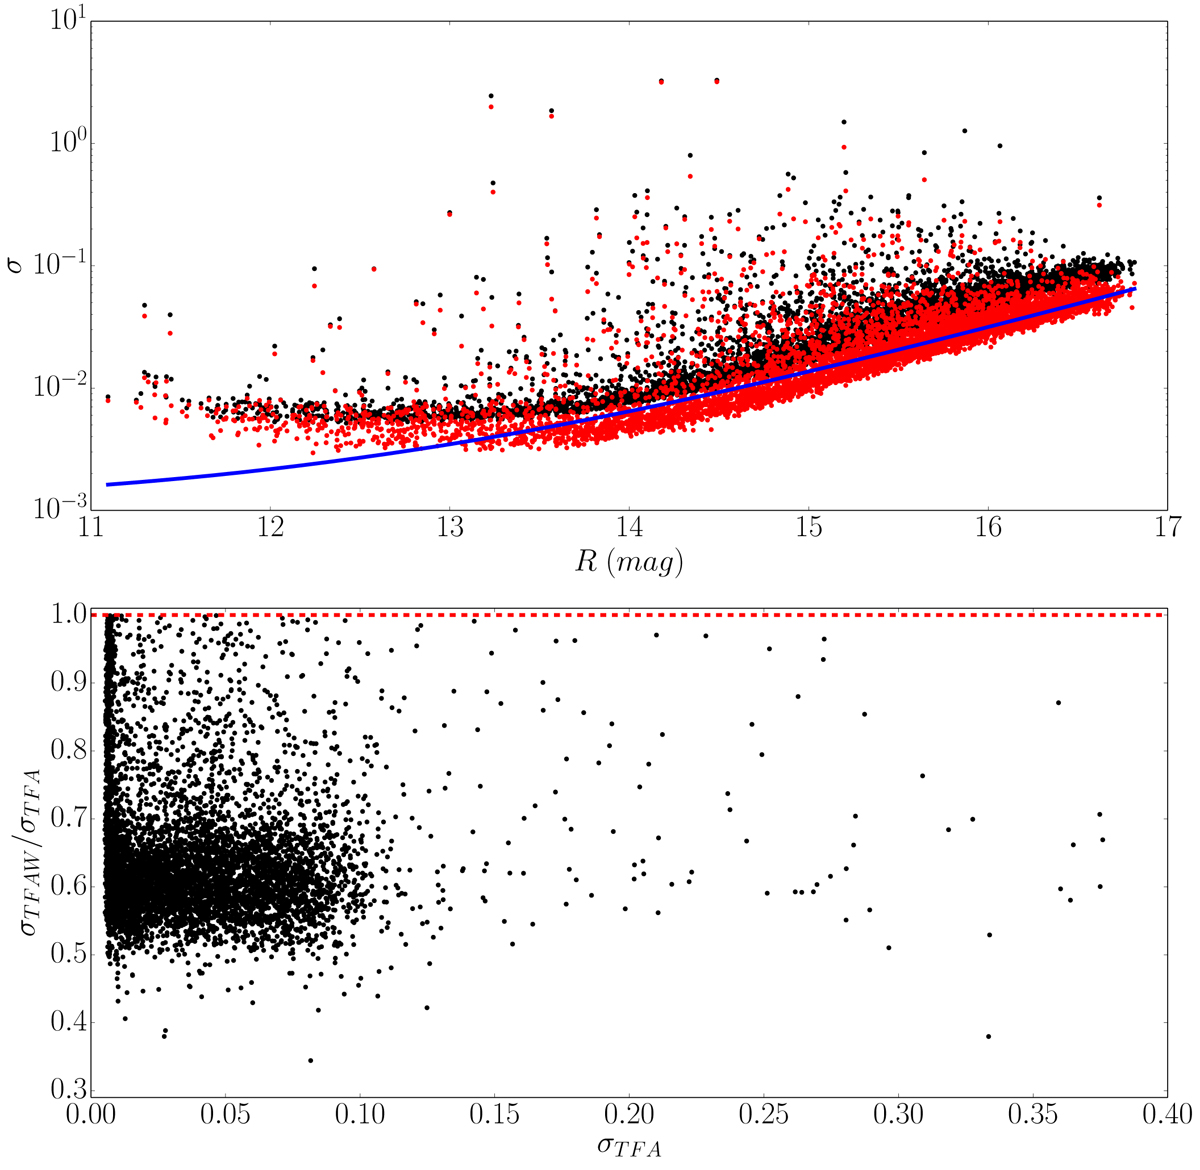
Top: standard deviation versus R magnitude for TFA (black dots) and TFAW (red dots) of a set of 6485 TFRM-PSES light curves. Blue line corresponds to the sum of the scintillation, photon, background and read-out noises. Bottom: decrease of the standard deviations for the same set of light curves due to the application of TFAW compared to TFA. Both TFA and TFAW results were obtained using 250 template stars. The red line corresponds to the zero correction level.
Current usage metrics show cumulative count of Article Views (full-text article views including HTML views, PDF and ePub downloads, according to the available data) and Abstracts Views on Vision4Press platform.
Data correspond to usage on the plateform after 2015. The current usage metrics is available 48-96 hours after online publication and is updated daily on week days.
Initial download of the metrics may take a while.