Free Access
Fig. 13.
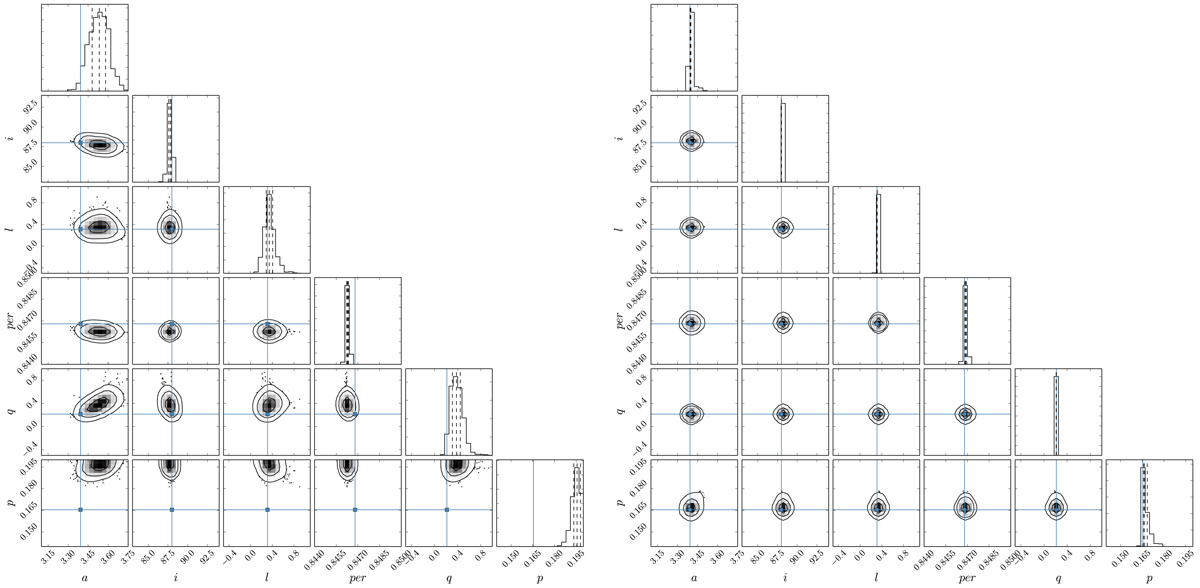
1D and 2D projections of the posterior probability distributions of the 6 MCMC fitted parameters for the TFA (left) and TFAW (right) detrended light curves. The injected values for (a, q, i, P, p, l) are marked in solid blue. The 25%, 50%, 75% quantiles, are displayed in dash vertical lines on the 1-D histograms.
Current usage metrics show cumulative count of Article Views (full-text article views including HTML views, PDF and ePub downloads, according to the available data) and Abstracts Views on Vision4Press platform.
Data correspond to usage on the plateform after 2015. The current usage metrics is available 48-96 hours after online publication and is updated daily on week days.
Initial download of the metrics may take a while.