Free Access
Fig. 1.
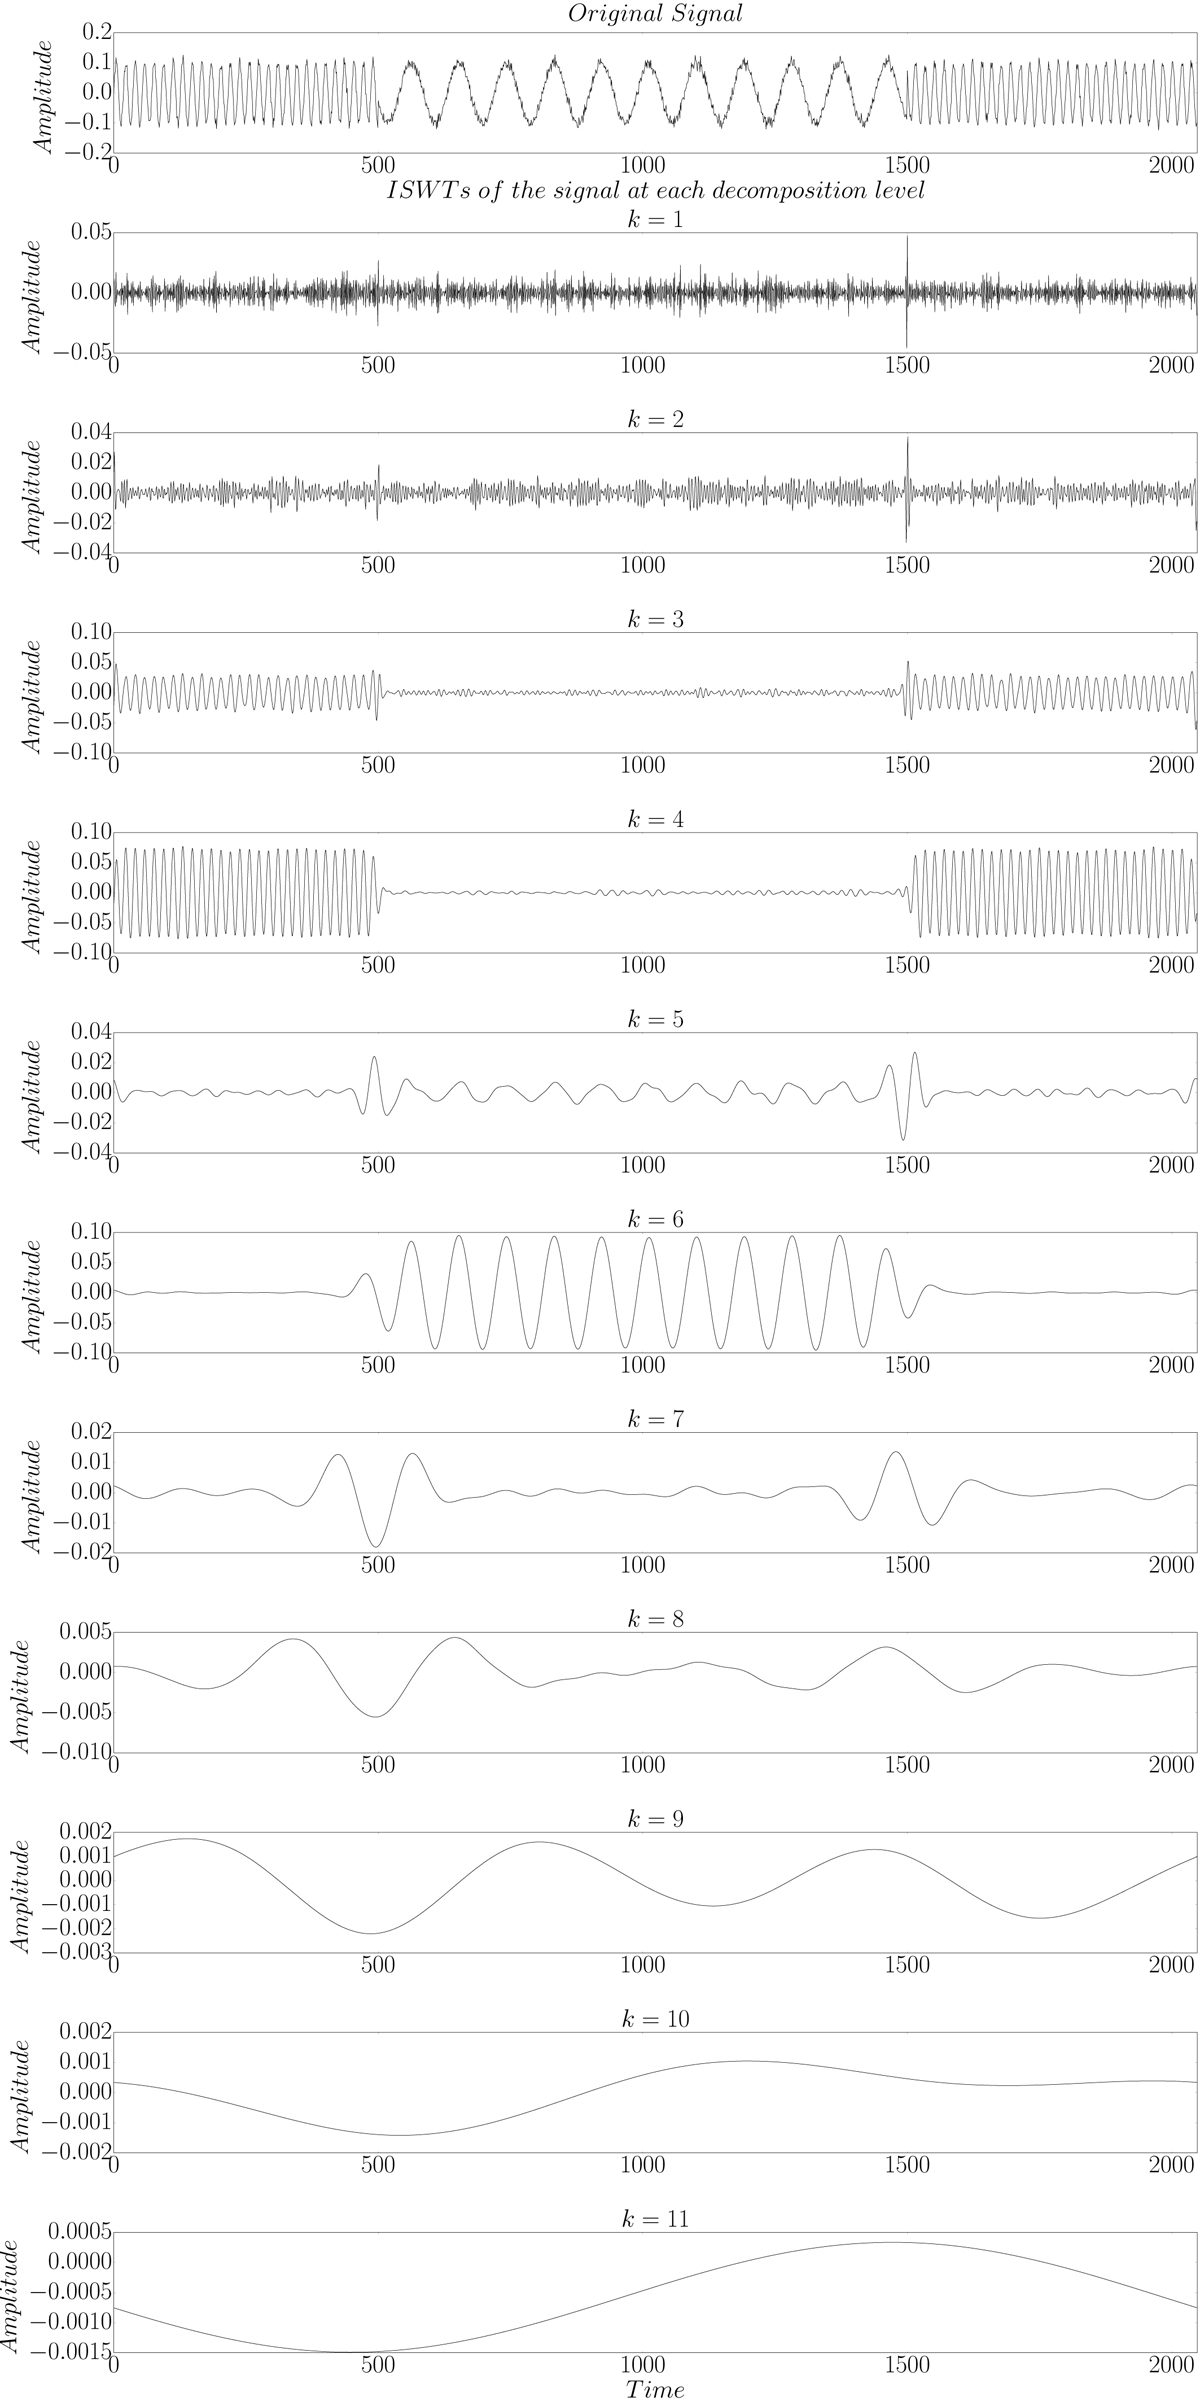
SWT decomposition of a test signal. The uppermost plot shows the test signal as described in Sect. 2.2, consisting of two sinusoidal signals and Gaussian random noise. The following plots represent the ISWT transform of the signal at each SWT decomposition level (k = 1,...,11).
Current usage metrics show cumulative count of Article Views (full-text article views including HTML views, PDF and ePub downloads, according to the available data) and Abstracts Views on Vision4Press platform.
Data correspond to usage on the plateform after 2015. The current usage metrics is available 48-96 hours after online publication and is updated daily on week days.
Initial download of the metrics may take a while.