Fig. 7.
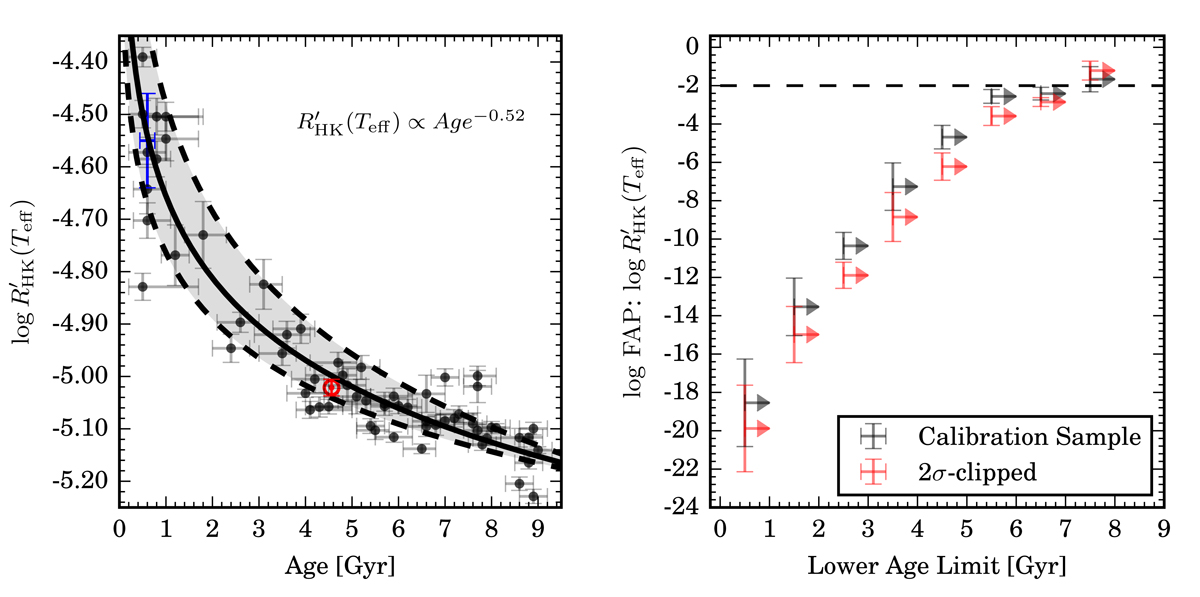
Left panel: age-activity relation derived for solar twins. The solid line is the best fit. The Sun is plotted with its usual symbol. Stars younger than 1 Gyr are represented as a single cluster (blue error bar) with mean activity ![]() and age = 0.6 ± 0.2 Gyr. The shaded region is the 2σ activity variability prediction band. Right panel: statistical significance of the AC relation as a function of the lower age limit. Black and red symbols are the results for the entire calibration sample and after a single round of 2σ clipping removal, respectively. The false-alarm probabilities reach ≈1% around 7 Gyr.
and age = 0.6 ± 0.2 Gyr. The shaded region is the 2σ activity variability prediction band. Right panel: statistical significance of the AC relation as a function of the lower age limit. Black and red symbols are the results for the entire calibration sample and after a single round of 2σ clipping removal, respectively. The false-alarm probabilities reach ≈1% around 7 Gyr.
Current usage metrics show cumulative count of Article Views (full-text article views including HTML views, PDF and ePub downloads, according to the available data) and Abstracts Views on Vision4Press platform.
Data correspond to usage on the plateform after 2015. The current usage metrics is available 48-96 hours after online publication and is updated daily on week days.
Initial download of the metrics may take a while.