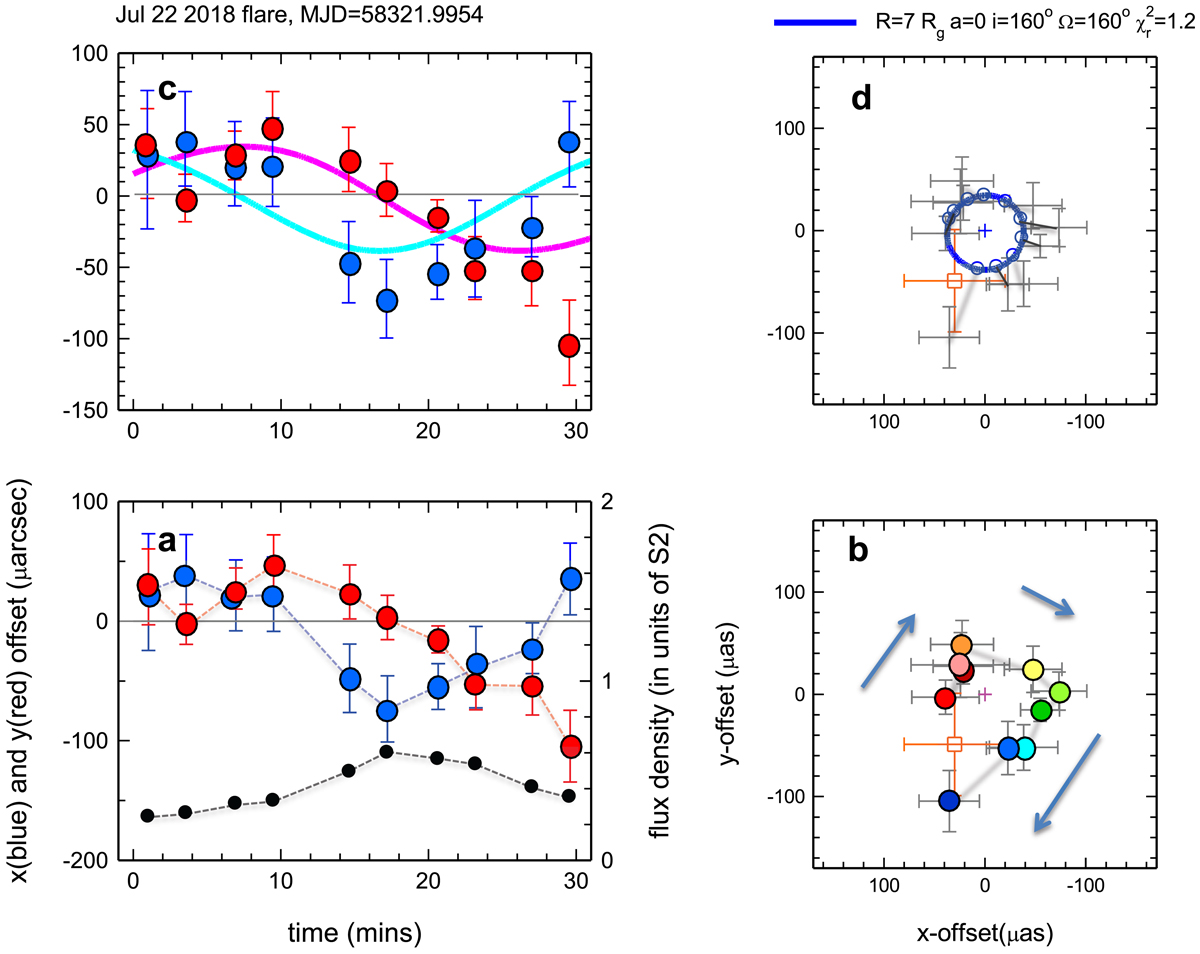
Fig. 1.

Bottom left (panel a): time evolution of the east-west (east positive, blue) and north-south (red) position offset of the July 22 flare (MJD = 58321.9954) centroids from their medians, as well as the flux density evolution (right y-axis, black) in units of the flux of S2 (14.0 mag). Error bars are 1σ. For this purpose the total intensity was computed from the sum of the two polarization directions. The points represent the average of the “Pfuhl” and “Waisberg” analyses (see Appendix B). Bottom right (panel b): projected orbit of the flare centroid on the sky (colour ranging from brown to dark blue as a qualitative marker of time through the 30 min observation, relative to their medians (small black cross) and after removal of the S2 motion and differential refraction between S2 and SgrA*). The orange square and 1σ uncertainty is the long-term astrometric position of the mass centre of the S2 orbit (approximately the orbital centroid, although shifts between apparent and true centroids can be introduced by lensing, relativistic beaming, and azimuthal shearing of an initially compact “hot spot”). Top left (panel c) and top right (panel d): comparison of the data of the bottom two panels with a realization of a simple hot spot model in the Schwarzschild metric, including light bending, lensing, time dilation and other effects of GR and/or special relativity (SR), computed from the NERO relativistic ray tracing code (Bauböck et al., in prep.). Similar results were obtained with the GYOTO code (Vincent et al. 2011b; Grould et al. 2016). The purple and cyan continuous curves in (c) show the same orbit in x(t) and y(t), compared to the data in blue and red. The continuous blue curve in (d) denotes a hot spot on a circular orbit with R = 1.17 × R(ISCO, a = 0, M = 4.14 × 10⁶ M⊙), seen at inclination 160° (clockwise on the sky, as for the data in (d)) and with the line of nodes at Ω = 160° (χr2 = 1.2). Open blue circles and grey bars connect the data points to their locations on the best fit orbit.
Current usage metrics show cumulative count of Article Views (full-text article views including HTML views, PDF and ePub downloads, according to the available data) and Abstracts Views on Vision4Press platform.
Data correspond to usage on the plateform after 2015. The current usage metrics is available 48-96 hours after online publication and is updated daily on week days.
Initial download of the metrics may take a while.


