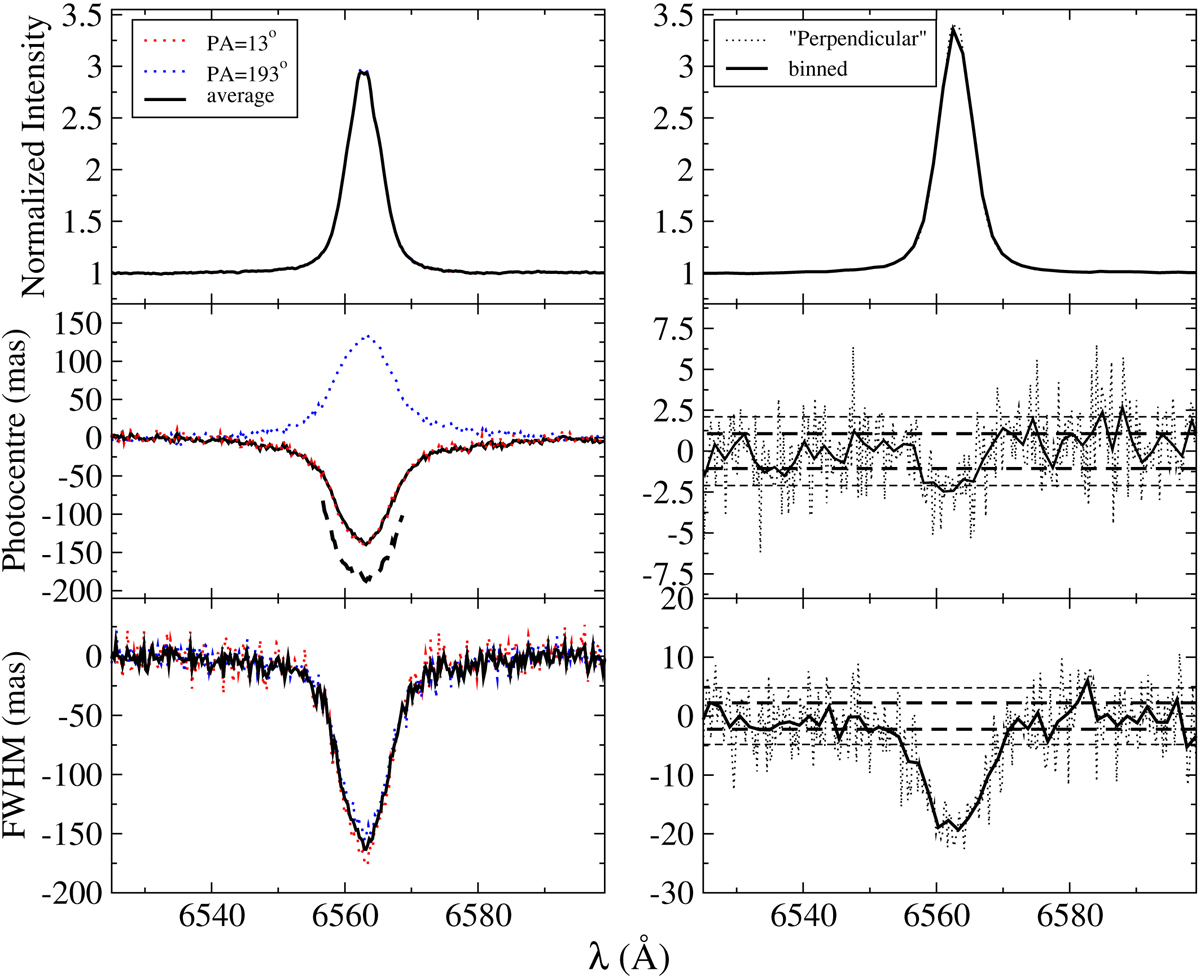
Fig. 1.

Intensity, photocenter, and FWHM spectra of GU CMa from top to bottom for the parallel (left) and perpendicular (right) slit directions. The left panels plot the individual spectra for the two parallel positions and the averaged spectra (see legend). The continuum-corrected photocenter shift is indicated with the black dashed line in the middle left panel. The right panels show the averaged spectra for the perpendicular orientation (PA = 103° and 283°) with the original spectral resolution (dotted lines) and after rebinning (solid lines). The corresponding ±1σ levels are shown in the middle and bottom right panels with the horizontal normal and bold dashed lines, indicating ±2.1, ±1.1, and ±4.8, ±2.2 mas for the photocenter and FWHM accuracies.
Current usage metrics show cumulative count of Article Views (full-text article views including HTML views, PDF and ePub downloads, according to the available data) and Abstracts Views on Vision4Press platform.
Data correspond to usage on the plateform after 2015. The current usage metrics is available 48-96 hours after online publication and is updated daily on week days.
Initial download of the metrics may take a while.


