Fig. 5
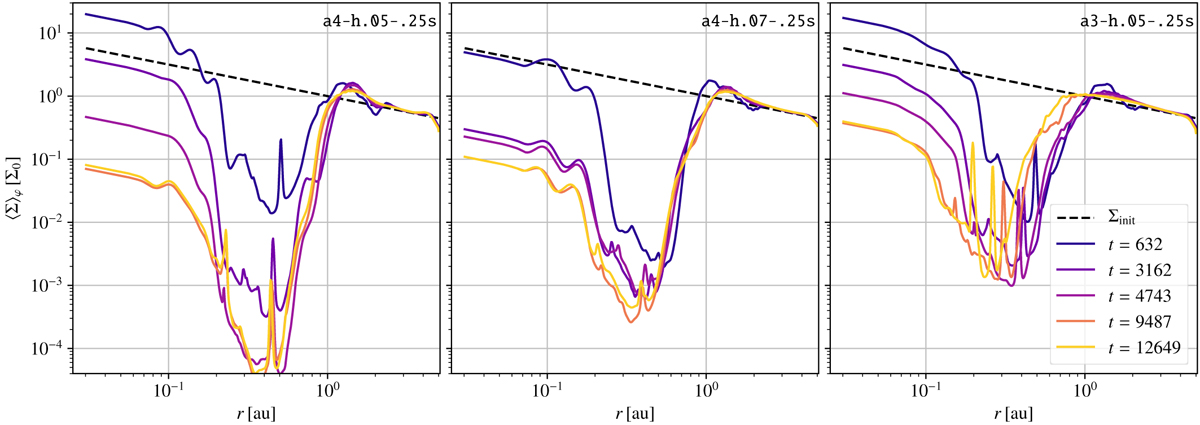
Time-series of the azimuthally averaged surface density profile for three models. The left panel shows our results for the reference model. Clearly visible is a decrease of the surface density in the inner disk and the gap. The migration of the Neptune into the gap can be recognized by the plateau that it creates in the surface density profile at later times. The middle and right panels show the same quantity for a model with increased aspect ratio and viscosity, respectively.
Current usage metrics show cumulative count of Article Views (full-text article views including HTML views, PDF and ePub downloads, according to the available data) and Abstracts Views on Vision4Press platform.
Data correspond to usage on the plateform after 2015. The current usage metrics is available 48-96 hours after online publication and is updated daily on week days.
Initial download of the metrics may take a while.