Fig. 5.
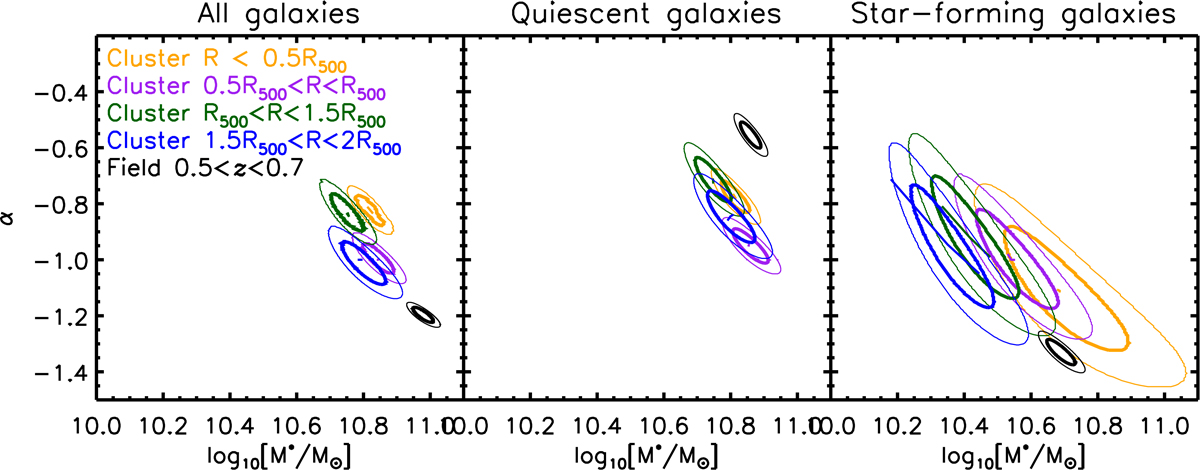
68% and 95% likelihood contours for the Schechter parameters α and M*, for the different galaxy types in different panels. Black: schechter parameters of field galaxy population. Other colours: schechter parameters of the cluster galaxies, in different radial bins, as indicated. The lines within the contours indicate how cosmic variance (+/−1σ) affects the best-fit Schechter parameters. That effect is strongest for the star-forming galaxies at large clustercentric distances, where the overdensity compared to the background is lowest.
Current usage metrics show cumulative count of Article Views (full-text article views including HTML views, PDF and ePub downloads, according to the available data) and Abstracts Views on Vision4Press platform.
Data correspond to usage on the plateform after 2015. The current usage metrics is available 48-96 hours after online publication and is updated daily on week days.
Initial download of the metrics may take a while.