Fig. 8
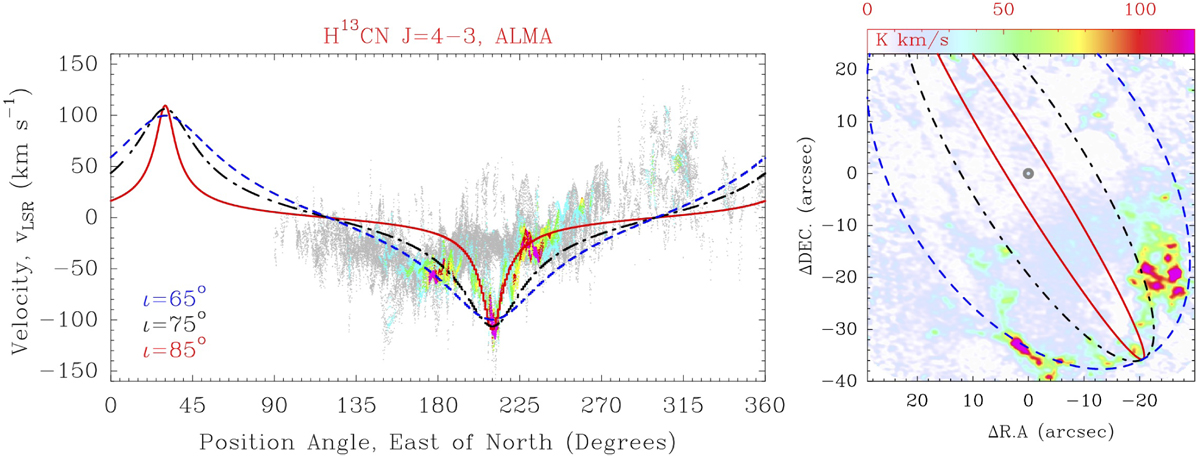
Mean H13CN (J = 4–3) velocities and models of rotating circular rings for the CND. Left: observed velocities as a function of position angle on the sky (from north to east). Colors represent the same intensity scale as in the integrated line intensity image shown in the right panel. Curves show models of rotating, tilted rings with a circular velocity vϕ = 110 km s−1, θ =30°, and differentinclination angles i. Right: integrated intensity map and resulting orbits (with a deprojected radius of 1.7 pc in this example).
Current usage metrics show cumulative count of Article Views (full-text article views including HTML views, PDF and ePub downloads, according to the available data) and Abstracts Views on Vision4Press platform.
Data correspond to usage on the plateform after 2015. The current usage metrics is available 48-96 hours after online publication and is updated daily on week days.
Initial download of the metrics may take a while.