Fig. 6
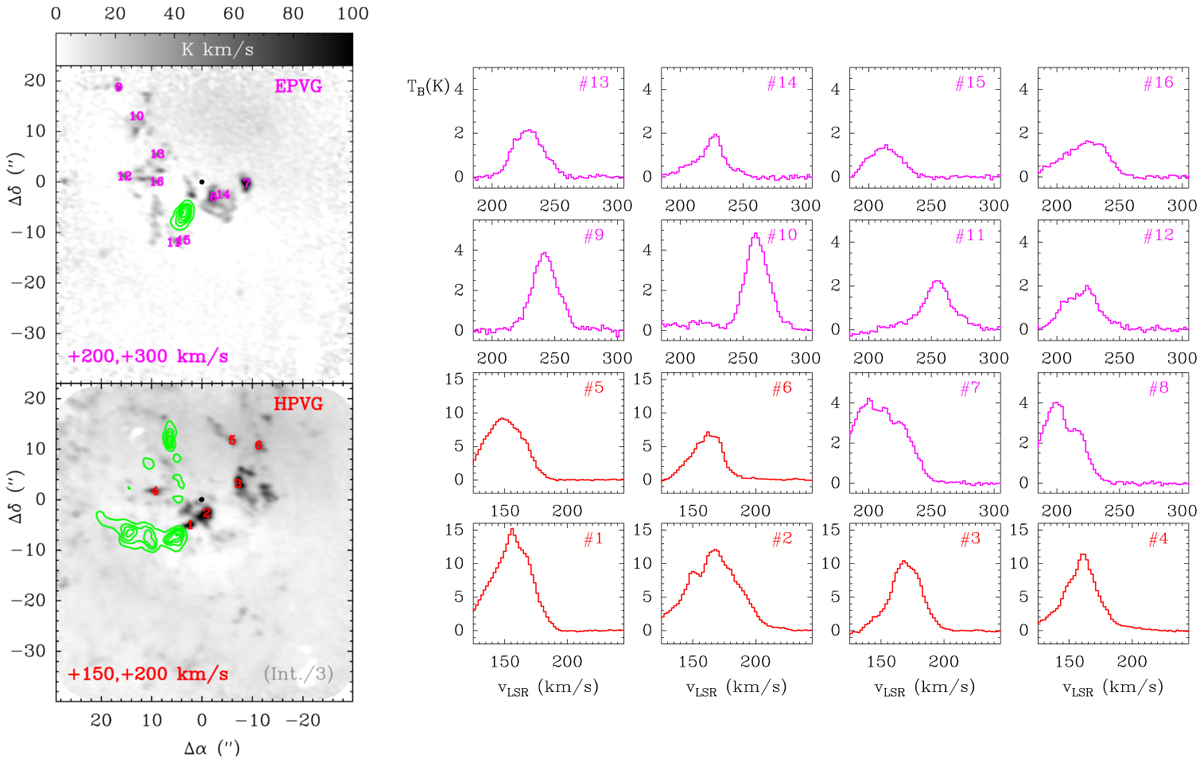
Left: EPVG (magenta, top) and HPVG (red, bottom) molecular cloudlets, numbered, for which we have extracted their 12CO J = 3–2 spectra. The gray images show the 12CO J = 3–2 line emission integrated in the velocity interval displayed in each panel. The green contours shows the ionized gas emission in the same velocity range ([Ne II]12.8 μm line from Irons et al. 2012). Sgr A* is displayed with a black dot. Right: EPVG (magenta) and HPVG (red) cloudlet spectra. The numbers correspond to their position in the left panels. In each panel the velocity axis has a common width of 125 km s−1. Gaussian line fit parameters are tabulated in Table B.1.
Current usage metrics show cumulative count of Article Views (full-text article views including HTML views, PDF and ePub downloads, according to the available data) and Abstracts Views on Vision4Press platform.
Data correspond to usage on the plateform after 2015. The current usage metrics is available 48-96 hours after online publication and is updated daily on week days.
Initial download of the metrics may take a while.