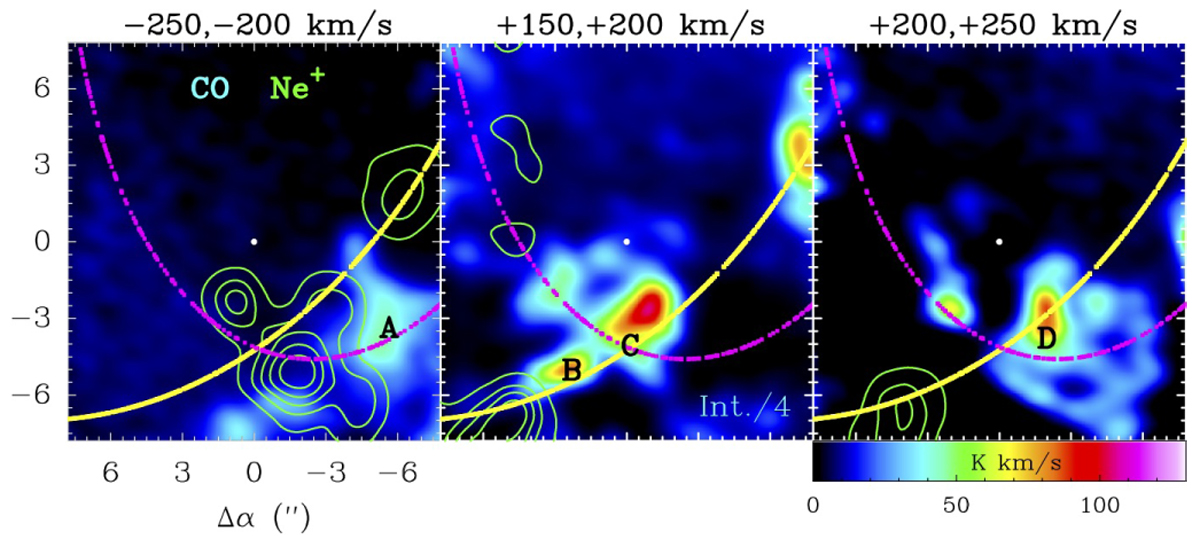
Fig. 5

Zoom into the central light-year of the Galaxy. Images show CO (J = 3–2) high-speed channel maps (left: vLSR = −250 to −200 km s−1, middle: vLSR = +150 to +200 km s−1, and right: vLSR = +200 to +250 km s−1), showing the integrated line intensity from 0 to 130 K km s−1, and revealing molecular gas close to Sgr A*. Green contours show the ionized gas emission (Irons et al. 2012). The yellow and magenta tracks are segments of the Keplerian elliptical orbits along the eastern and northern arms respectively (Zhao et al. 2009).
Current usage metrics show cumulative count of Article Views (full-text article views including HTML views, PDF and ePub downloads, according to the available data) and Abstracts Views on Vision4Press platform.
Data correspond to usage on the plateform after 2015. The current usage metrics is available 48-96 hours after online publication and is updated daily on week days.
Initial download of the metrics may take a while.


