Fig. 4
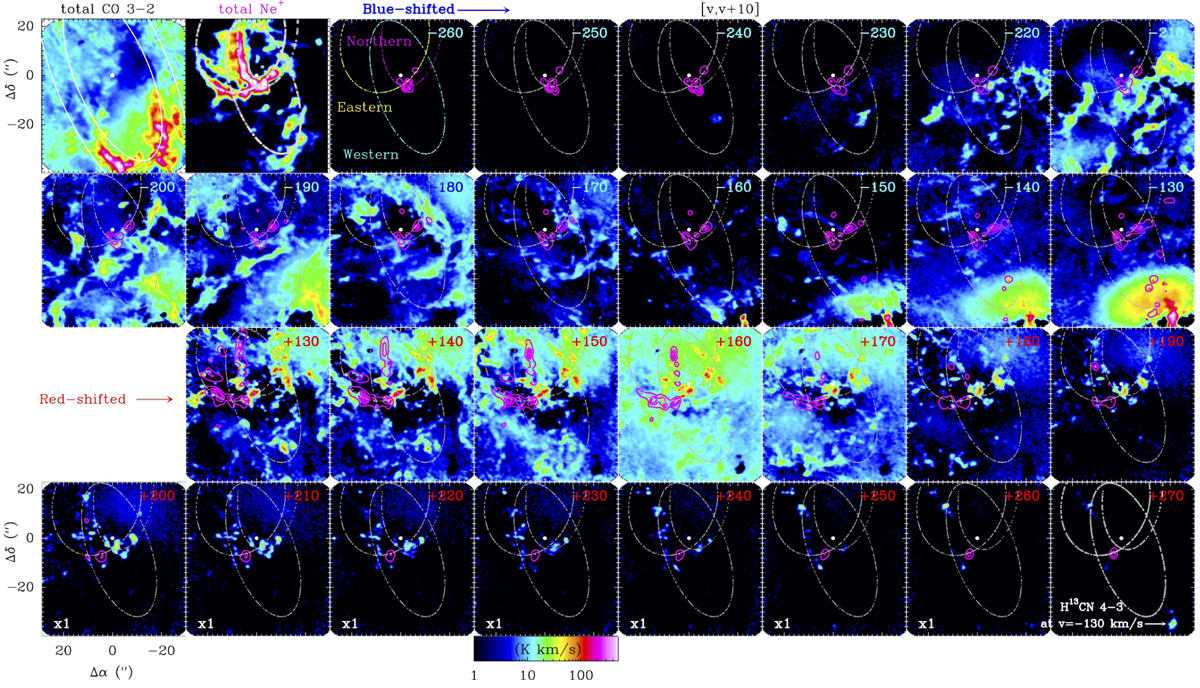
ALMA high-velocity 12CO (J = 3–2) and IRTF [Ne II]12.8 μm high-velocity channel maps from vLSR = −260 to −120 km s−1 (blue-shifted) and from vLSR = +130 to +280 km s−1 (red-shifted)in steps of 10 km s−1. The two top left panels show 12CO (J = 3–2) and [Ne II]12.8 μm total integrated line intensity maps. White curves in the 12CO (J = 3–2) map represent a CND model bounded by two rotating circular rings (with i = 66°, θ = 23°) with inner and outer deprojected radii of 1.5 and 2.3 pc respectively. Gray curves represent the three Keplerian elliptical orbits proposed to fit the motion of the ionized gas streamers (Zhao et al. 2009). All the other panels show 12CO velocity channel maps (for intensities between 1 and 500 K km s−1 in logarithm scale) with the specific velocity interval [v, v + 10] displayed at each corner. The ionized gas emission in the mini-spiral is shown in magenta contours (from Irons et al. 2012). Sgr A* is at position (0″, 0″) and is displayed with a white dot.
Current usage metrics show cumulative count of Article Views (full-text article views including HTML views, PDF and ePub downloads, according to the available data) and Abstracts Views on Vision4Press platform.
Data correspond to usage on the plateform after 2015. The current usage metrics is available 48-96 hours after online publication and is updated daily on week days.
Initial download of the metrics may take a while.