Fig. 2
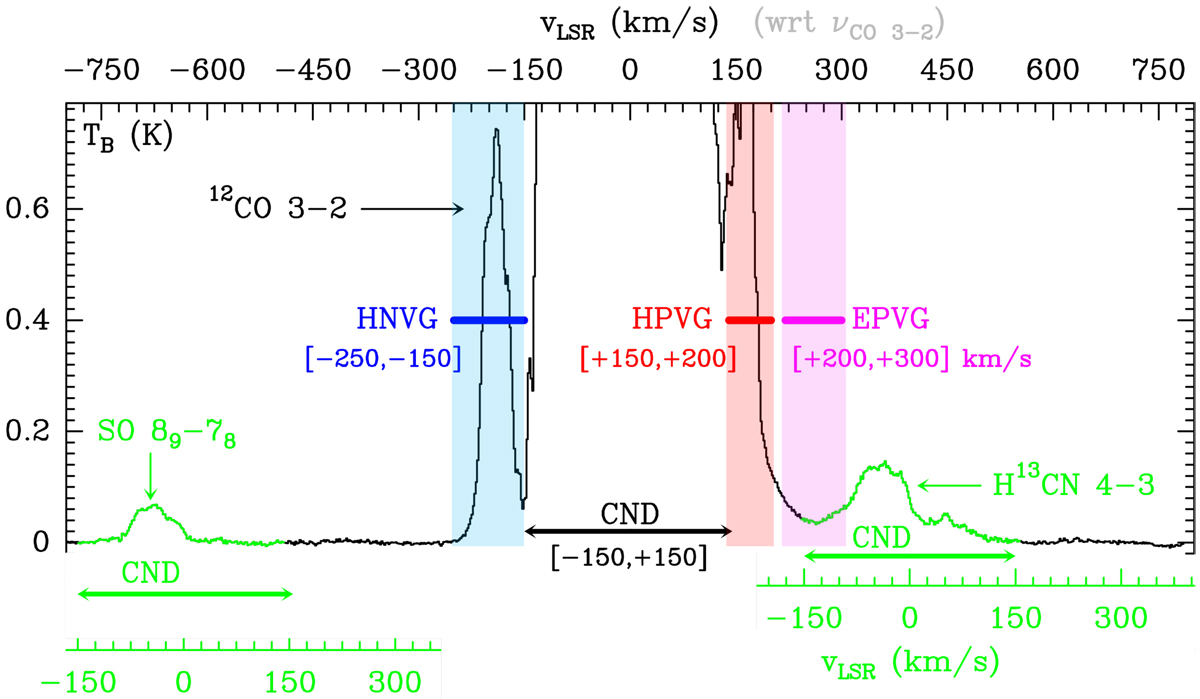
ALMA plus total-power spectrum around 345.8 GHz averaged over the observed field-of-view. The black histogram shows the spectrum centered at the frequency of the CO J = 3–2 line (LSR velocity scale shown in the upper horizontal axis). The green spectra (and lower velocity axes) show the same for the SO 89–78 and H13CN J = 4–3 lines, both dominantly emitted from the CND in the velocity range |vLSR| < 150 km s−1 (blanked out for CO). In addition to this standard velocity range, CO shows higher positive and negative velocity emission components: EPVG, HPVG, and HNVG (defined in the text) in magenta, red, and blue respectively. Owing to the similar spatial distribution of the SO and H13CN line emission, the CO EPVG features can be easily distinguished from the blue-shifted H13CN J = 4–3 emission in the images (see text).
Current usage metrics show cumulative count of Article Views (full-text article views including HTML views, PDF and ePub downloads, according to the available data) and Abstracts Views on Vision4Press platform.
Data correspond to usage on the plateform after 2015. The current usage metrics is available 48-96 hours after online publication and is updated daily on week days.
Initial download of the metrics may take a while.