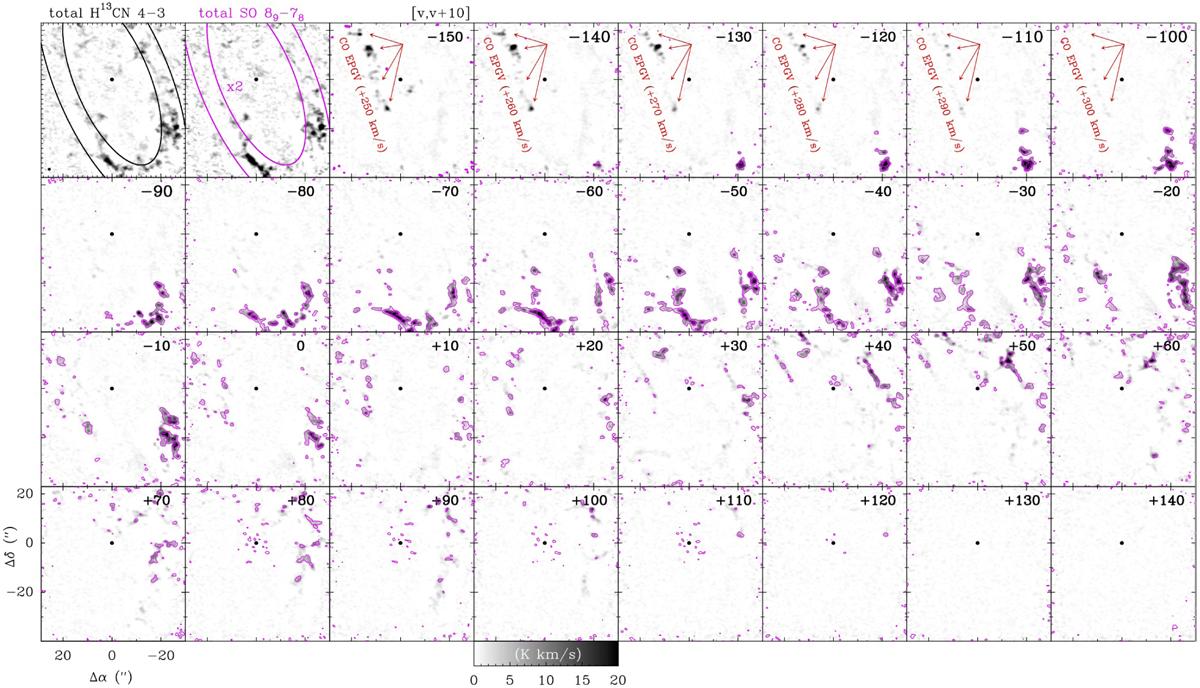
Fig. A.2

Nearly identical spatial distribution of H13CN (J = 4–3) and SO (89–78) from ALMA interferometer data alone (zero-spacing data not merged). The two top left panels show total integrated line intensity maps. The other maps show H13CN (J = 4–3) (black images) and SO (89–78) (magenta contours) channel maps from vLSR=−150 to +150 km s−1 in steps of 10 km s−1. At all velocities, most H13CN and SO features spatially match (i.e., they belong to the same gas structure). The emission features seen at negative velocities without SO emission counterpart, however, do not arise from blue-shifted H13CN emission butfrom red-shifted 12CO cloudlets. Sgr A* is at position (0″, 0″).
Current usage metrics show cumulative count of Article Views (full-text article views including HTML views, PDF and ePub downloads, according to the available data) and Abstracts Views on Vision4Press platform.
Data correspond to usage on the plateform after 2015. The current usage metrics is available 48-96 hours after online publication and is updated daily on week days.
Initial download of the metrics may take a while.


