Fig. 12
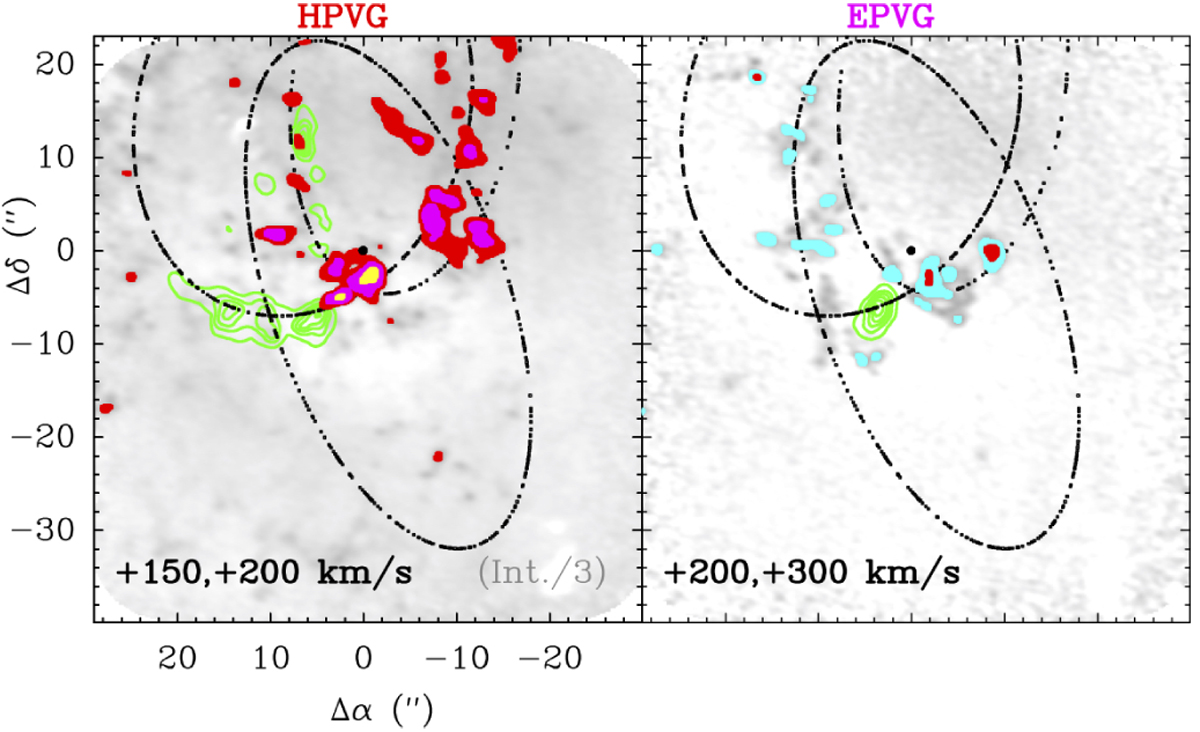
Approximate visual extinction (AV) map produced by the HPVG and EPVG cloudlets and obtained from 12CO assuming a uniform abundance x(12CO) = 2 × 10⁻⁵ and a single rotational temperature Trot(12CO) = 100 K (see text). The color code shows the estimated extinction peaks: AV ≈ 6–9 (yellow), AV ≈ 3–6 (magenta), AV ≈ 1.5–3 (red), and AV≈0.6–1.5 mag (cyan, shown only in the right panel). The gray images show the 12CO J = 3–2 line emission integrated in the velocity interval displayed in each panel. The green contours shows the ionized gas [Ne II]12.8 μm emission at the same velocities (Irons et al. 2012).
Current usage metrics show cumulative count of Article Views (full-text article views including HTML views, PDF and ePub downloads, according to the available data) and Abstracts Views on Vision4Press platform.
Data correspond to usage on the plateform after 2015. The current usage metrics is available 48-96 hours after online publication and is updated daily on week days.
Initial download of the metrics may take a while.