Fig. 1
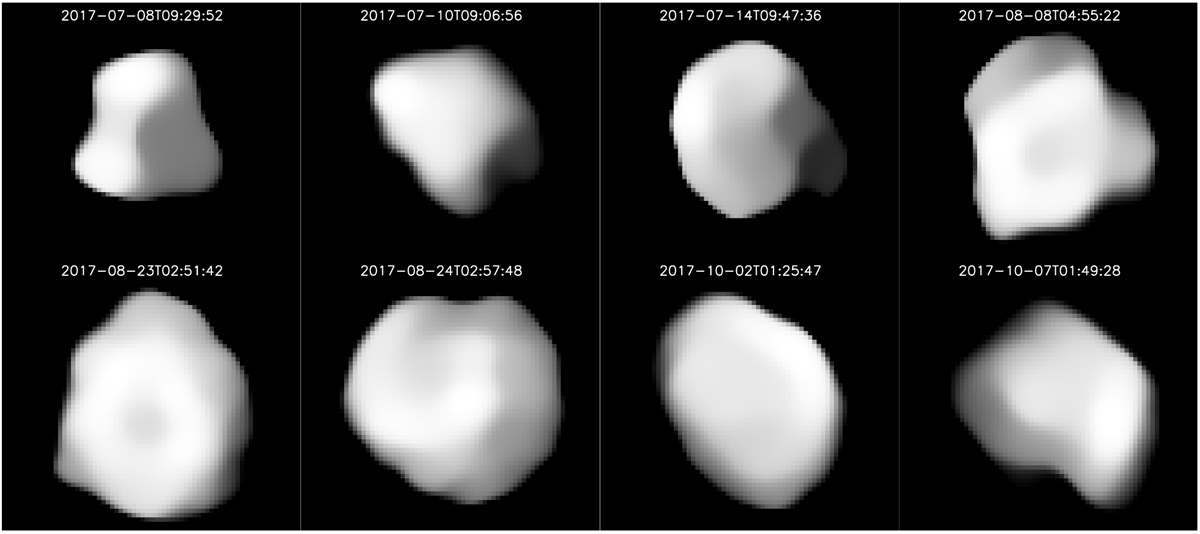
VLT-SPHERE/ZIMPOL images of Julia obtained between July 8 and October 7, 2017 (and therefore at different geocentric distances), and deconvolved with the MISTRAL algorithm. North is up at approximately − 2° and east is left. Here, we display only one image per epoch. The full set of images is shown in Fig. B.1. For the epochs with the highest contrast (typically epochs 2 and 3), we observe a variation in the intensity between the brightest and darkest areas on the order of 50%. We interpret these rather circular, low-intensity areas as craters (see Fig. 3).
Current usage metrics show cumulative count of Article Views (full-text article views including HTML views, PDF and ePub downloads, according to the available data) and Abstracts Views on Vision4Press platform.
Data correspond to usage on the plateform after 2015. The current usage metrics is available 48-96 hours after online publication and is updated daily on week days.
Initial download of the metrics may take a while.